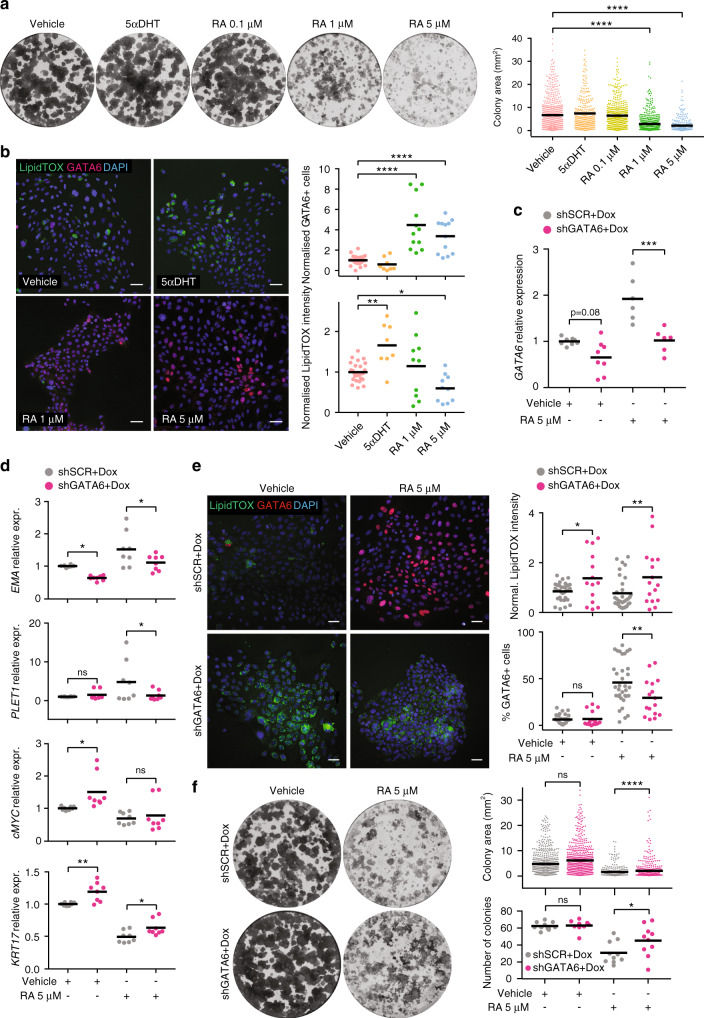
Fig. 5. GATA6 overexpression phenocopies retinoic acid effect on sebocytes.
a Area of colonies formed by SebE6E7 sebocytes cultured with vehicle or 100 nM 5αDHT, 0.1 μM RA, 1 μM RA or 5 μM RA (n = 10 for Vehicle, n = 6 for 5αDHT, n = 8 for RA conditions). Representative dishes and quantitation are shown. b Sebocytes treated for 5 days with vehicle (n = 26) or 100 nM 5αDHT (n = 8), 1 μM RA or 5 μM RA (n = 12 for RA conditions for GATA6 analysis and n = 10 for RA conditions for LipidTOX analysis). Representative images of LipidTOX and GATA6 labelling and quantitation are shown. Values are expressed as FC versus vehicle condition. c Inhibition of GATA6 expression by shGATA6 lentiviruses. Sebocytes were infected with shSCR or shGATA6 lentiviruses and treated with 1 μg ml−1 Dox with vehicle or 5 μM RA for 5 days (n = 8 for vehicle conditions, n = 6 for RA conditions). RT-qPCR of GATA6 expression normalised to housekeeping genes. Values are expressed as FC versus shSCR+Dox+Vehicle values. d–f Inhibition of GATA6 by shGATA6 reduces the effects of RA on sebocytes. Cells were treated as in c. d Expression of EMA, PLET1, KRT17, and cMYC (n = 8/condition). e Quantitation of representative images of LipidTOX and GATA6 labelling (n = 34 for shSCR conditions, n = 14 for shGATA6+Dox+Vehicle, n = 16 for shGATA6+Dox+RA). Values are expressed as FC over shSCR+Dox+Vehicle condition. f Number of colonies and colony area (n = 10/condition). Representative dishes are shown. b, e Nuclei were counterstained with DAPI. Scale bars: 50 μm (b, e). a–f Data are means with individual values and were obtained from three (a, b, e) or four (c, d, f) independent experiments corresponding to n replicates. Statistical analysis was performed with ordinary one-way ANOVA (a–f). ns not significant; *p-value < 0.05; **p-value < 0.005; ***p-value < 0.0005; ****p-value < 0.00005. a–f Source data are provided as a Source Data file.

