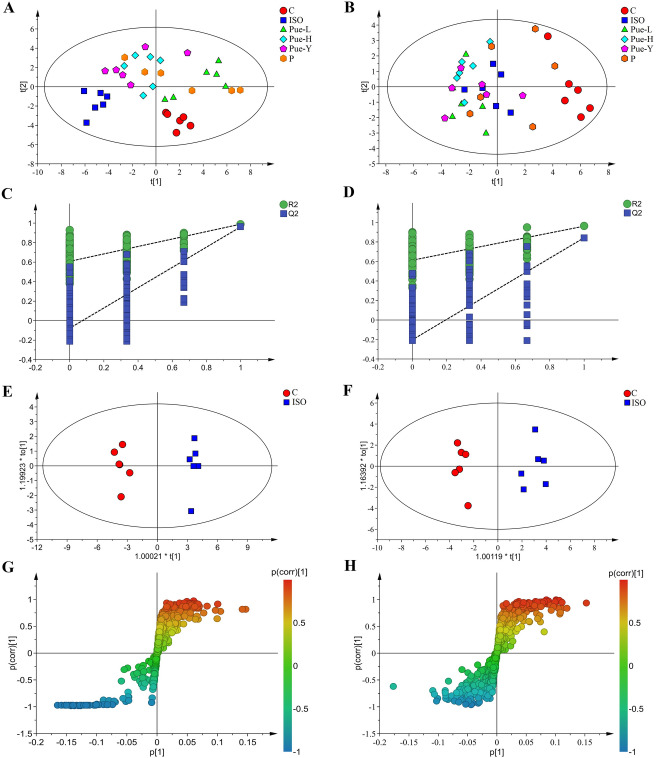
Figure 3.
The metabolic profiles of serum and heart samples. The PCA score plot in serum (A) and in cardiac tissues (B) among the six groups. The PLS-DA validation plot obtained from 200 permutation tests in serum (C) and in cardiac tissues (D) for the models of normal and model groups. The OPLS-DA score plot in serum (E) and in cardiac tissues (F) from the control and ISO groups. The S-plots of OPLS-DA score plot in serum (G) and in cardiac tissues (H) between the control and ISO groups.

