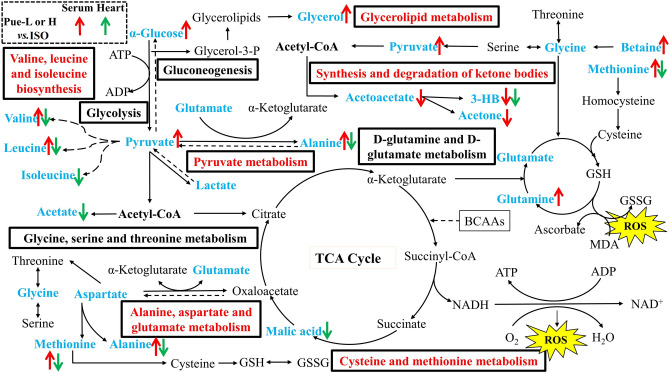
Figure 8.
Alterations of metabolites and possible metabolic pathways in myocardial tissues and serum. The metabolites in blue font were altered in MI and metabolic pathways in red font were regulated by the new crystal form of puerarin. And the different colors of arrows represent the altered trends of metabolites that were regulated by the new crystal form of puerarin in the serum and myocardial tissues (red represented the serum, and green represented the myocardial tissues) in the Pue-L or Pue-H groups compared with the model groups, respectively.

