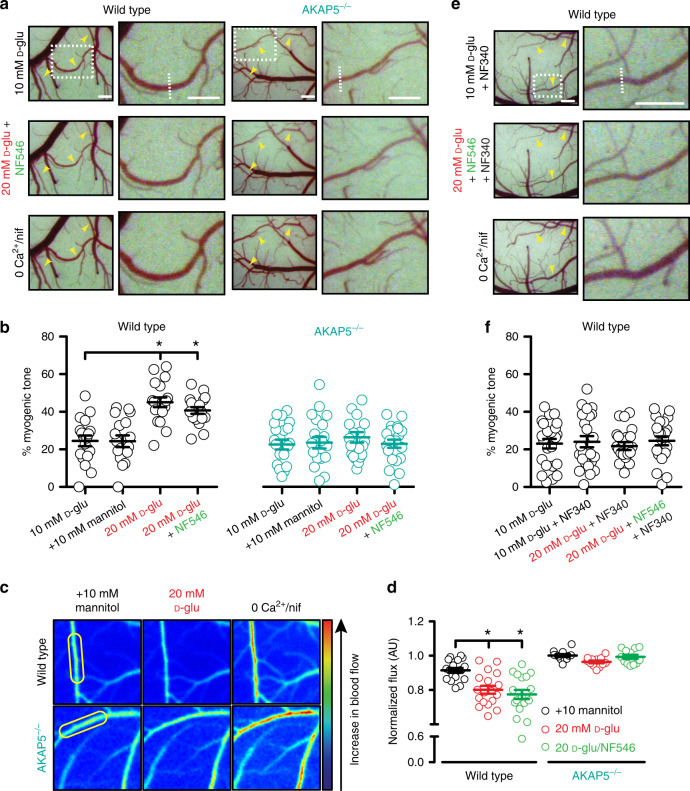
Fig. 4. Glucose/NF546 effects on myogenic tone/blood flow require AKAP5.
a Exemplary open cranial window images of wild-type (WT; n = 18 arteries/3 mice) and AKAP5−/− (n = 21 arteries/3 mice) middle cerebral arteries and branches exposed to 10 mM D-glucose (D-glu), 20 mM D-glu + NF546, and 0 Ca2+ + 1 μM nifedipine (nif). b Summary myogenic tone data. *P < 0.05 with Friedman one-way ANOVA with Dunn’s multiple comparisons. Significance was compared to the 10 mM D-glu group. P < 0.0001 for WT 10 mM D-glu-20 mM D-glu and P = 0.0004 for WT 10 mM D-glu-20 mM D-glu + NF546. c Representative pseudo-colored blood flow images of cerebral pial arteries through a cranial window exposed to 10 mM D-glu + 10 mM mannitol, 20 mM D-glu, and 0 Ca2+ + 1 μM nif in WT and AKAP5−/− mice. d Summary blood flow data in WT (n = 18 arteries/5 mice) and AKAP5−/− (n = 12 arteries/3 mice) mice. *P < 0.05 with Friedman one-way ANOVA with Dunn’s multiple comparisons. Significance was compared to the +10 mM mannitol group. P = 0.0007 for WT mannitol-20 mM D-glu and P < 0.0001 for WT mannitol-20 mM D-glu + NF546. The yellow ovals highlight regions that were used for analysis. e Representative open cranial window images of WT (n = 23 arteries/3 mice) middle cerebral arteries and branches in 10 mM D-glu + 10 µM NF340, 20 mM D-glu + 500 nM NF546 + 10 µM NF340, and 0 Ca2+ + 1 µM nif. f Amalgamated myogenic tone data. *P < 0.05, Friedman one-way ANOVA with Dunn’s multiple comparisons. Significance was compared to the 10 mM D-glucose group. Data represent mean ± SEM. In (a) and (e), yellow arrows = arteries, dotted rectangles highlight zoom regions on the right side panels, and dotted lines in the zoom images highlight regions that were used for analysis. Scale bars = 50 pixels for the main figures and 70 pixels for the insets. Source data are provided as Source data file.

