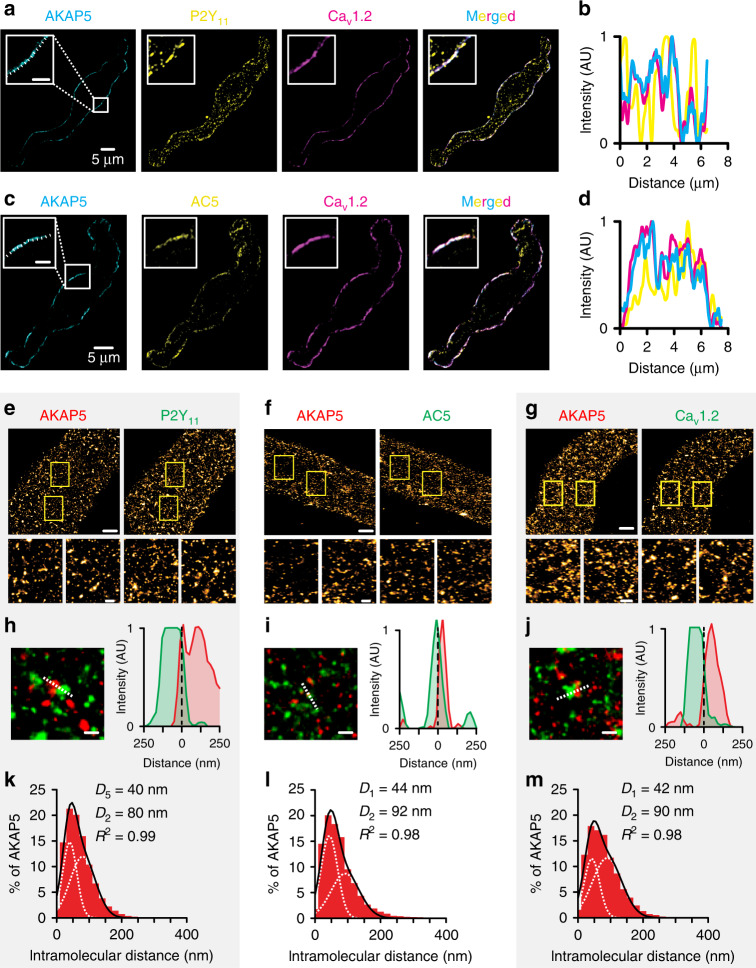
Fig. 5. AKAP5 closely associates with P2Y11-like, AC5, and CaV1.2.
Representative super-resolution Airyscan intensity projection images and line intensity profile of arterial myocytes triple-labeled for either a, b AKAP5 (cyan), P2Y11 (yellow), and CaV1.2 (magenta) or c, d AKAP5 (cyan), AC5 (yellow), and CaV1.2 (magenta). Merged images are on the right side panels. The magnified insets are from regions highlighted by the white squares in the AKAP5 images. Insets’ scale bars = 2 μm. Line intensity profiles obtained from the regions below the dotted lines in the magnified insets in (a) and (c). Similar results were observed in six different cells from two independent preparations per condition. Representative super-resolution GSD reconstruction maps of arterial myocytes labeled for e AKAP5 and P2Y11, f AKAP5 and AC5, or g AKAP5 and CaV1.2 (scale bar = 2 µm). Two magnified areas obtained from the region highlighted by the yellow boxes in the main figure are shown (scale bar = 200 nm). These magnified panels are intended to provide a clearer view of cluster size and distribution in two areas of a cell. Enlarged merged images (left) and associated x–y fluorescence intensity profile (right) from the areas highlighted by the dotted lines of areas of close proximity between h AKAP5 and P2Y11, i AKAP5 and AC5, or j AKAP5 and CaV1.2 (scale bar = 200 nm). Histograms of the lowest intermolecular distance to AKAP5 centroids for k P2Y11 (n = 11,778 particles from 4 cells/2 WT mice), l AC5 (n = 10,049 particles from 5 cells/2 WT mice), or m CaV1.2 (n = 14,750 particles from 5 cells/2 WT mice) fluorescence particles. Data were fit with a sum of two Gaussian functions with depicted centroids and R2. Source data are provided as Source data file.

