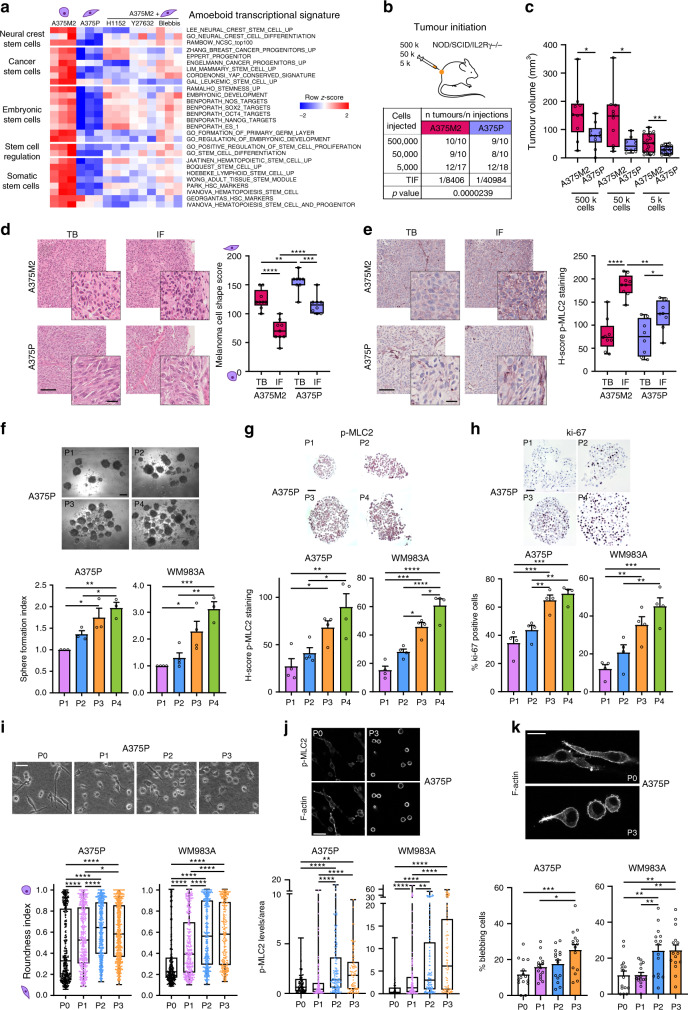
Fig. 1. Amoeboid cells support tumour initiation in melanoma in vitro and in vivo.
a Heatmap displaying enrichment scores for differentially expressed stem cell-related signatures in amoeboid A375M2 cells compared to A375P cells or to A375M2 cells treated with ROCK1/2 inhibitors (ROCKi) (H1152 and Y27632) or blebbistatin using single-sample Gene Set Enrichment Analysis (ssGSEA). b, c Limiting dilution assay estimating b tumour-initiating frequency (TIF) and c tumour volume of A375M2 and A375P cells when injected at different dilutions (500,000, 50,000 and 5,000 cells) into NOD/SCID/IL2Rγ−/− (NSG) mice (Number of tumours per condition indicated in table). TIF was determined using ELDA. d, e Representative images (left) and quantification (right) of d melanoma cell shape score and e H-score of p-MLC2 staining in tumour body (TB) and invasive front (IF) of A375M2 (n = 9) and A375P (n = 8) tumours from 50,000 cells’ condition from (b). Scale bar, 100 μm; inset, 25 μm. f Representative phase-contrast images (top) and quantification of sphere formation index (bottom) of A375P (n = 3) and WM983A cells (n = 4) serially passaged. Scale bar, 250 μm. g, h Representative images (top) and quantification (bottom) of g H-score of p-MLC2 staining and h ki-67 positive cells in A375P and WM983A spheres serially passaged (n = 4). Scale bar, 50 μm. i–k Representative i phase-contrast and j, k confocal images (top) and quantification (bottom) of i cell morphology (>250 cells pooled from n = 3), j p-MLC2 immunofluorescence signal normalized by cell area (>80 cells pooled from n = 4) and k percentage of blebbing cells (5 fields of view per experiment, >75 cells per experiment, n = 3) of individual A375P and WM983A cells from adherent conditions (P0) and from dissociated cells from spheres serially passaged (P1–P3) on collagen I matrix. Scale bar, i, j 50 μm and k 20 μm. c–e, i, j Box limits show 25th and 75th percentiles, the horizontal line shows the median, and whiskers show the minimum and maximum range of values. f–h, k Graphs show mean ± s.e.m. f–k n means number of independent biological experiments. c two-tailed t-test. d–h, k One-way ANOVA with Tukey post-hoc test. i, j Kruskal–Wallis with Dunn’s multiple comparison test. For all graphs, *p < 0.05, **p < 0.01, ***p < 0.001, ****p < 0.0001. The exact significant p values for *p, **p and ***p are provided in Supplementary Table 1. Mouse schematic in this figure was created using Servier Medical Art templates licensed under a Creative Commons Attribution 3.0 Unported License (https://smart.servier.com).

