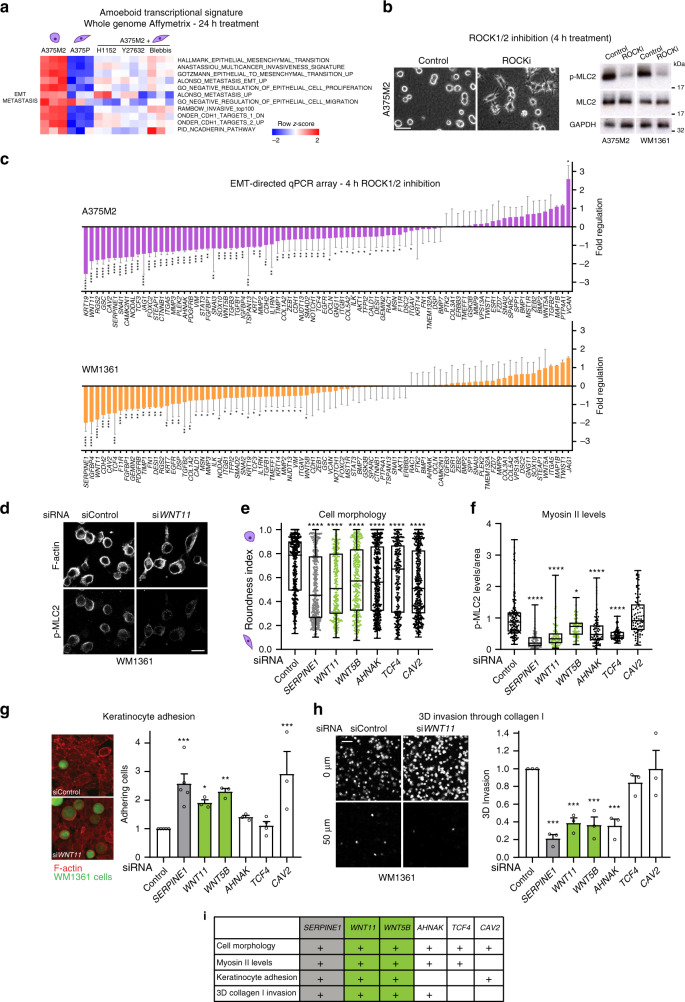
Fig. 2. EMT genes regulated by ROCK1/2 control amoeboid invasive features.
a Heatmap displaying enrichment scores for differentially expressed EMT and metastasis-related signatures in amoeboid A375M2 cells compared to A375P cells or to A375M2 cells treated with ROCKi (H1152 and Y27632) or blebbistatin using ssGSEA. b Representative phase-contrast images of A375M2 cells on top of collagen I matrix (left) and immunoblots of p-MLC2 in A375M2 and WM1361 cells (right) after 4 h treatment with ROCKi (H1152) (n = 3). Scale bar, 50 μm. c Fold regulation of EMT-related gene expression from EMT-directed qPCR array in A375M2 and WM1361 cells treated with ROCKi (H1152) for 4 h (n = 4). d Representative confocal images of p-MLC2 and F-actin staining in WM1361 cells on collagen I matrix after WNT11 knockdown (n = 3). Scale bar, 20 μm. e Quantification of cell morphology (>280 cells pooled from n = 3) and f p-MLC2 immunofluorescence signal normalized by cell area (>85 cells pooled from n = 3) in WM1361 cells on collagen I matrix after depletion of indicated genes. g Representative confocal images (left) and quantification (right) of adhesion of WM1361 cells to a monolayer of keratinocytes after depletion of indicated genes (n = 5 for SERPINE1, n = 4 for TCF4, n = 3 for WNT11, WNT5B, AHNAK and CAV2). Scale bar, 20 μm. h Representative confocal images (left) and quantification (right) of 3D invasion index through a collagen I matrix of WM1361 cells after depletion of indicated genes (n = 3). Scale bar, 50 μm. i Summary table of amoeboid functional assays on WM1361 cells after SERPINE1, WNT11, WNT5B, AHNAK, TCF4 and CAV2 knockdown. “+” sign indicates a significant phenotype of the corresponding gene knockdown. c, g, h Graphs show mean ± s.e.m. e, f Box limits show 25th and 75th percentiles, the horizontal line shows the median, and whiskers show minimum and maximum range of values. b–h n means number of independent biological experiments. c Two-tailed t-test with Benjamini, Krieger and Yekutieli correction for multiple comparisons. e, f Kruskal–Wallis test with Benjamini, Krieger and Yekutieli correction. g, h One-way ANOVA with Benjamini, Krieger and Yekutieli correction. For all graphs, *p < 0.05, **p < 0.01, ***p < 0.001, ****p < 0.0001. The exact significant p values for *p, **p and ***p are provided in Supplementary Table 1.

