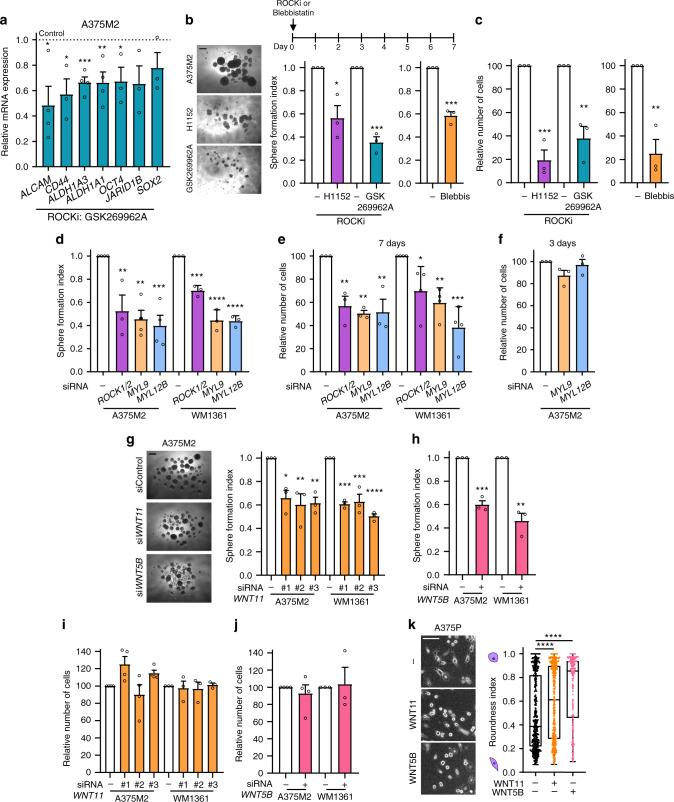
Fig. 3. Non-canonical Wnt ligands support melanosphere formation and amoeboid behaviour.
a mRNA expression of stem cell-related markers by qRT-PCR in A375M2 cells treated with ROCKi (GSK269962A) for 24 h compared to control A375M2 cells (n = 4 for ALCAM, ALDH1A3, ALDH1A1; n = 3 for CD44, OCT4, JARID1B, SOX2). b Schematic of treatment (top), representative phase-contrast images (bottom left) and quantification of sphere formation index (bottom right) and c cell viability of A375M2 cells and A375M2 cells treated with one dose of ROCKi (H1152 or GSK269962A) or blebbistatin (n = 3). Scale bar, 250 μm. d–f After ROCK1/2, MYL9 or MYL12B knockdown in A375M2 and WM1361 cells, quantification of d sphere formation index (n = 4 for A375M2, n = 3 for WM1361) and e, f cell viability after e 7 days (n = 3 for A375M2, n = 4 for WM1361) or f 3 days (n = 3) of cell seeding. g–j After WNT11 or WNT5B knockdown in A375M2 and WM1361 cells, g, h representative phase-contrast images (left) and quantification of sphere formation index (right) (n = 3) and i, j cell viability (n = 4 for A375M2, n = 3 for WM1361). Scale bar, 250 μm. k Representative phase-contrast images (left) and quantification of cell morphology (right) of A375P cells after 24 h of WNT11 or WNT5B stimulation (>225 cells pooled from n = 3). Scale bar, 100 μm. a–j Graphs show mean ± s.e.m. k Box limits show 25th and 75th percentiles, the horizontal line shows the median, and whiskers show minimum and maximum range of values. a–k n means number of independent biological experiments. a–c, h, j Two-tailed t-test. d–g, i One-way ANOVA with Dunnett post-hoc test. k Kruskal–Wallis with Dunn’s multiple comparison test. For all graphs, *p < 0.05, **p < 0.01, ***p < 0.001, ****p < 0.0001. The exact significant p values for *p, **p and ***p are provided in Supplementary Table 1.

