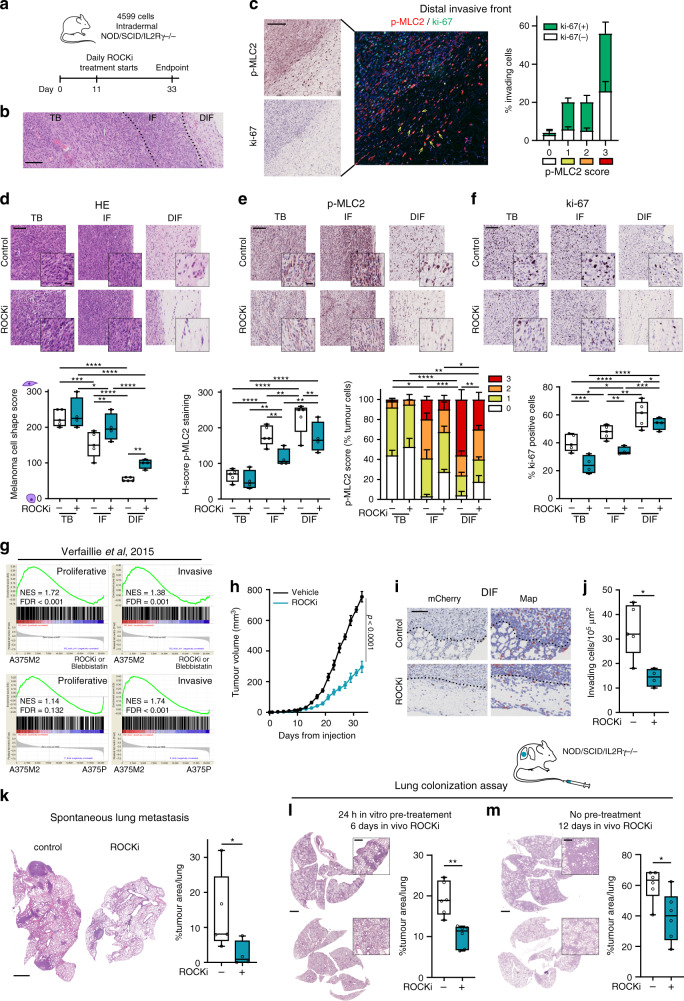
Fig. 6. Amoeboid behaviour enhances tumour formation, tumour progression and metastasis in vivo.
a Schematic of in vivo experiment with 4599 cells injected intradermally into NSG mice treated with ROCKi (25 mg/kg GSK269962A) or control (5% DMSO) (n = 5 mice for control and n = 4 for ROCKi). b Representative H&E images showing areas of TB, IF and local area of invasion into the dermis (distal invasive front (DIF)) of primary tumours derived from (a). Dashed lines represent the boundary between tumour areas. Scale bar, 200 μm. c Representative images (left) and quantification (right) of invading cells with co-staining of p-MLC2 (red) and ki-67 (green) at the DIF of control tumours from (a). Scale bar, 200 μm. Yellow arrows indicate ki-67 positive invading cells with p-MLC2 score 3 intensity. d–f Representative images (top) and quantification (bottom) of d melanoma cell shape score, e H-score and percentage of cells with score intensity 0–3 for p-MLC2 staining and f ki-67 positive cells in primary tumours from (a). Scale bar, 100 μm; inset, 25 μm. g GSEA plots showing enrichment of proliferative and invasive gene signatures from Verfaillie study19 in A375M2 cells compared to A375M2 cells treated with ROCKi (H1152 and Y27632) and blebbistatin or to A375P cells10. NES, normalized enrichment score; FDR, false discovery rate. h Tumour growth curves of 4599 cells from (a). i Representative images (left) and QuPath mark-up (right) of mCherry staining and j quantification of invading cells into the dermis in primary tumours derived from (a). Dashed lines represent the boundary between IF and DIF. Scale bar, 50 μm. k Representative images (left) and quantification of tumour area (right) of spontaneous lung metastasis from (a). Scale bar, 1 mm. l, m Representative images of mouse lungs (left) and quantification of tumour area (right) at the indicated times after tail vein injection of 4599 cells l pre-treated with ROCKi for 24 h or m without any pre-treatment into NSG mice. Animals were systemically treated with ROCKi (n = 6 mice/group). Scale bar, 2 mm; inset, 500 μm. c Graphs show mean ± s.e.m. d–f, j–m Box limits show 25th and 75th percentiles, the horizontal line shows the median, and whiskers show minimum and maximum range of values. d–f One-way ANOVA with Benjamini, Krieger and Yekutieli correction. h, j Two-tailed t-test. k–m Two-tailed Mann–Whitney test. For all graphs, *p < 0.05, **p < 0.01, ***p < 0.001, ****p < 0.0001. The exact significant p values for *p, **p and ***p are provided in Supplementary Table 1. Schematics in this figure were created using Servier Medical Art templates licensed under a Creative Commons Attribution 3.0 Unported License (https://smart.servier.com).

