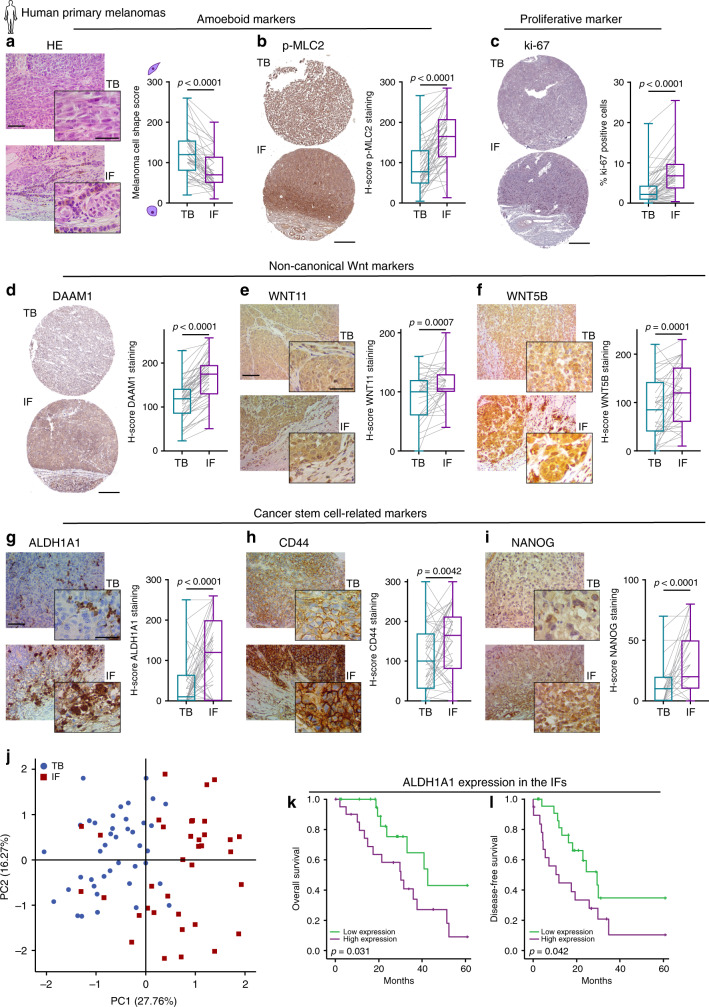
Fig. 7. Analysis of the invasive front of human primary melanomas.
a–i Representative images (left) and quantification (right) of a melanoma cell shape score, b H-score of p-MLC2 staining, c ki-67 positive cells, H-score of d DAAM1, e WNT11, f WNT5B, g ALDH1A1, h CD44 and i NANOG staining in matched TB and IF from primary melanomas. j Principal component analysis (PCA) based on the expression of amoeboid (cell shape and p-MLC2), proliferative (ki-67), non-canonical Wnt pathway (WNT11, WNT5B and DAAM1) and cancer stem cell-related (ALDH1A1, CD44 and NANOG) markers assessed by immunohistochemistry in matched TB and IF from primary melanomas. Percentage of variation explained by each component is given in the axis labels. k, l Kaplan–Meier survival curves of k overall survival and l disease-free survival according to ALDH1A1 protein expression in the IF from our cohort of primary melanomas. ALDH1A1 expression was categorized as low or high using the median expression. a–l 53 primary melanomas. a, e–i Scale bar, 100 μm; inset, 50 μm. b–d Scale bar, 300 μm. a–i Box limits show 25th and 75th percentiles, the horizontal line shows the median, and whiskers show the minimum and maximum range of values. a, b, d–f Two-tailed paired t-test. c, g–i Two-tailed Wilcoxon test. j Scatter plot showing principal components 1 (PC1) and 2 (PC2). k, l Log-rank test. Human schematic in this figure was created using Servier Medical Art templates licensed under a Creative Commons Attribution 3.0 Unported License (https://smart.servier.com).

