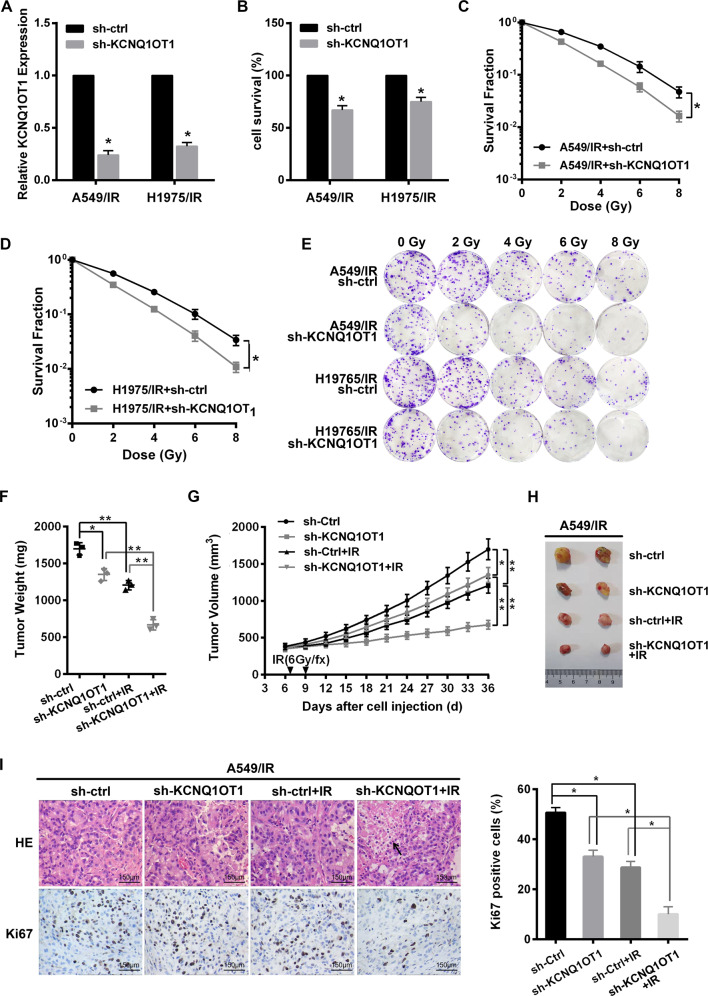
Fig. 2. KCNQ1OT1 knockdown repressed IR resistance of LUAD in vitro and in vivo.
A qRT-PCR analysis of KCNQ1OT1 expression in A549/IR and H1975/IR cells after infected with a control (sh-ctrl) or KCNQ1OT1 shRNA knockdown (sh-KCNQ1OT1) lentiviral vector. B Cell viability of KCNQ1OT1 knockdown and control A549/IR and H1975/IR via CKK8 assay. C–E Colony survival assay in KCNQ1OT1 knockdown and control A549/IR (C) and H1975/IR (D) cells exposed with indicated irradiation dosage. Representative images were presented (E). F–H The weights (F) and volumes (H) of subcutaneous xenografts from KCNQ1OT1 knockdown and control A549/IR cells in nude mice with or without IR, n = 3 in each group. Representative images of the xenografts were presented (H). G H&E staining, Ki67 expression by IHC in the xenografts derived from KCNQ1OT1 knockdown and control A549/IR cells with or without irradiation. Scale bars: 150 μm. The black arrow represents necrosis. The histograms showed the average Ki67 proliferative index of each group. Data are presented as the mean ± SD. from three independent experiments, *p < 0.05.

