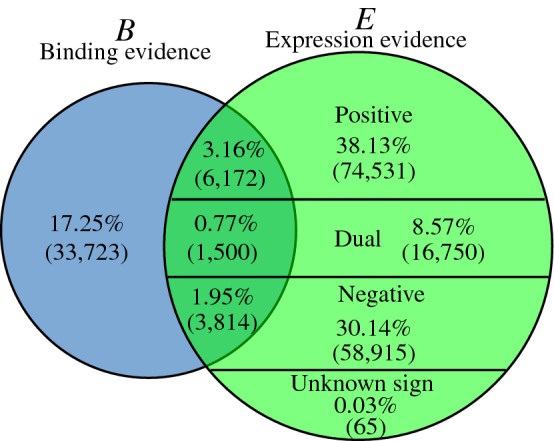
Figure 1.

Venn diagram showing the content of YEASTRACT regulatory associations between transcription factors and target genes in S. cerevisiae according to their classification in the sets B, E and B&E, depending on the supporting experimental evidence. In the set E (and B&E), expression evidence allows to attribute a sign to the associations. Percentages refer to the fractions of the total number of associations, i.e., the cardinality of B|E.
