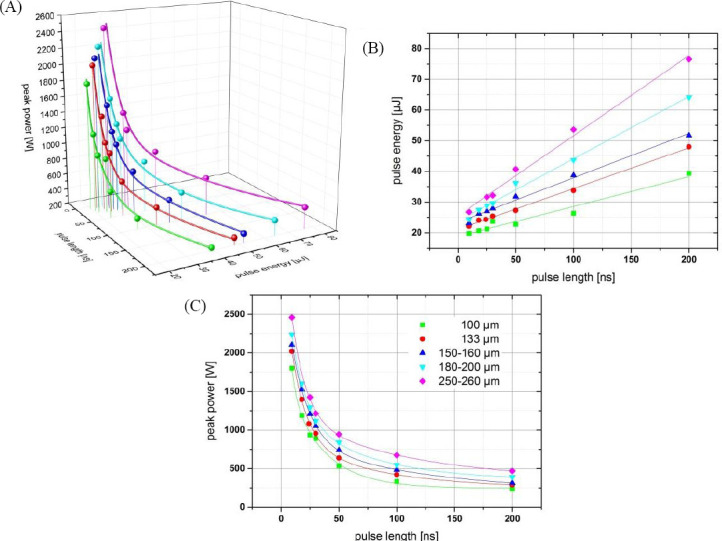
Figure 8.

Dependence of the printed droplet size on laser pulse duration, pulse energy, and resulting peak power. Each color represents a different printed droplet size. The measured values are depicted as spheres; the lines represent curves fitted to the measured values. With increasing pulse duration, the required energy increases linear (but not proportional) and the required peak power decreases inversely.
