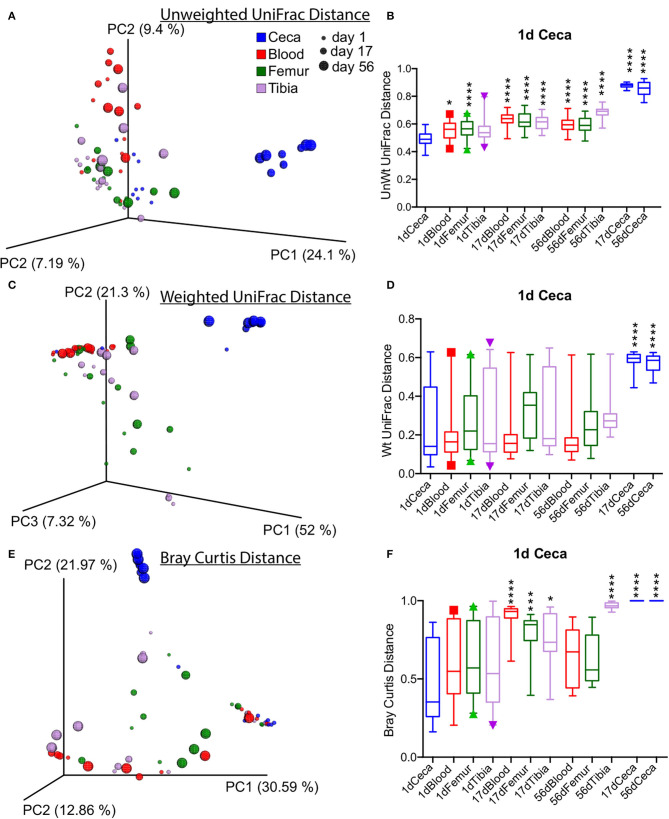
Figure 4.
Overall beta diversity across sites and ages of chickens. (A,C,E) Principal coordinate analysis (PCoA) plots of different sites of chickens measured by unweighted, weighted UniFrac, and Bray Curtis dissimilarity distance at an even subsampling depth of 600 sequences/sample. (B,D,F) Distance of ceca at day 1 to respective sites. Boxplot displays median with whisker representing 2.5–97.5 percentile. Samples were analyzed by t-test with Bonferroni correction. *p < 0.05, ***p < 0.001, ****p < 0.0001.

