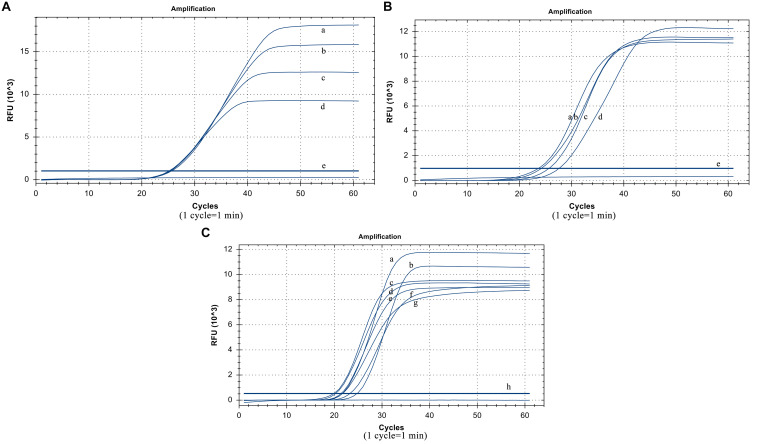
FIGURE 3.
Optimized results. (A) Usage of the loop primer probe. (a) 20 pmol, (b) 15 pmol, (c) 10 pmol, (d) 5 poml, (e) Negative control. (B) Usage of the loop primer. (a) 15 pmol, (b) 10 pmol, (c) 20 pmol, (d) 5 pmol, (e) Negative control. (C) Usage of Rnase H2 enzyme. (a)0.06 U/μL, (b) 0.02 U/μL, (c) 0.12 U/μL, (d) 0.1 U/μL, (e) 0.14 U/μL, (f) 0.04 U/μL, (g) 0.08 U/μL (h) Negative control.

