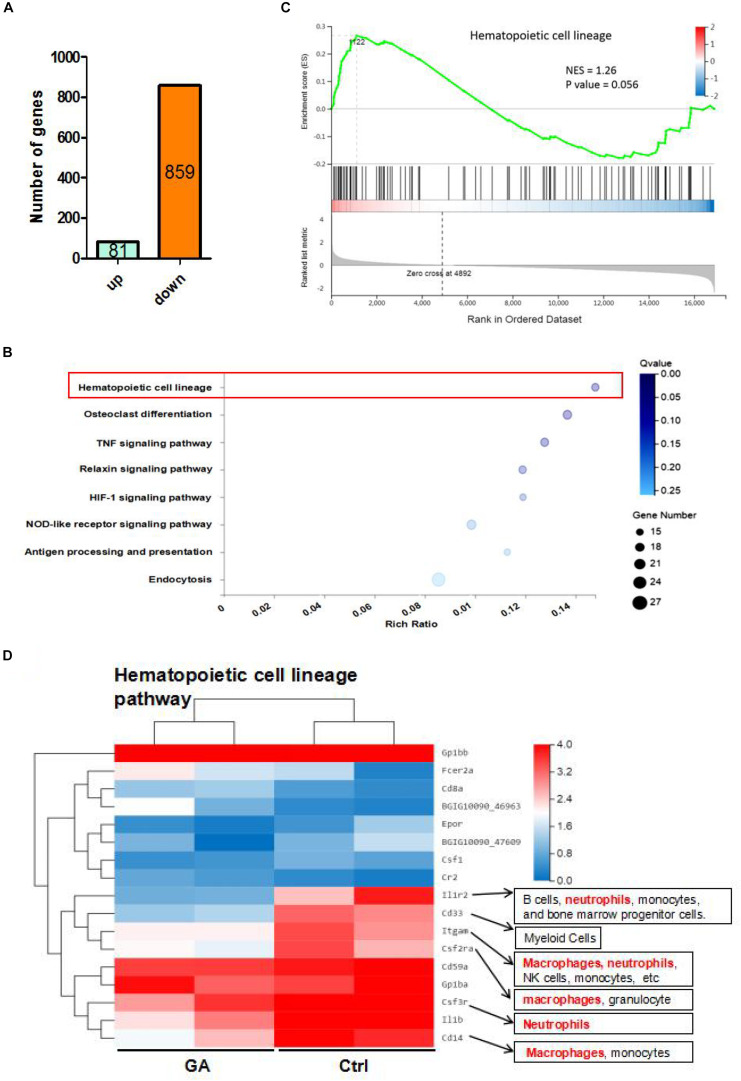
FIGURE 2.
The RNA-seq results of GA and control mice. (A) The differential expressed genes between GA and control group. (B) Enrichment plots of gene expression signatures for hematopoietic cell lineage. Barcode plot indicates positions of genes in each gene-set. NES, normalized enrichment score. (C) Bubble diagram showing GA treatment influence the hematopoietic cell lineage. (D) Heatmap showing differentially expressed genes (DEGs) in hematopoietic cell lineage of control and GA-treated C57BL/6 mice. There were two different representative mice from each treatment group.

