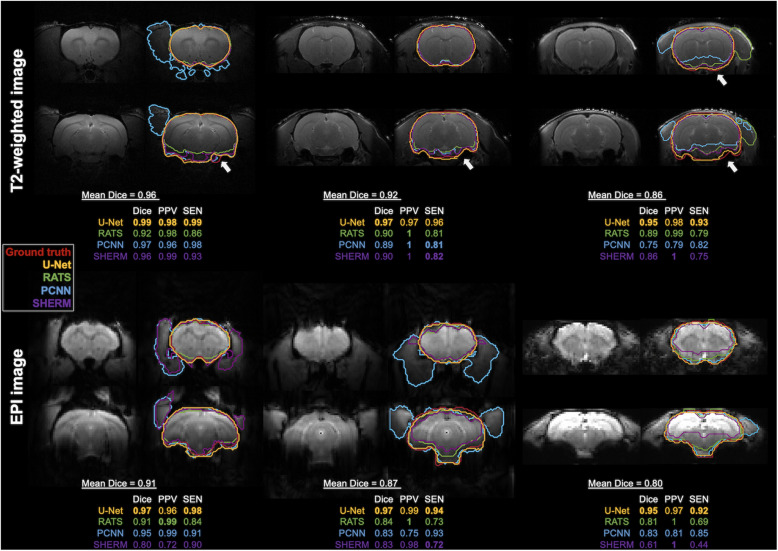
FIGURE 3.
Best, median, and worst segmentation comparisons for T2w RARE and T2*w EPI images from CAMRI dataset. These rats were chosen as they had the highest, median, and lowest mean Dice score (listed below the brain map) averaged over the four methods (U-Net, RATS, PCNN, and SHERM). Posterior and inferior slices (arrowhead) are more susceptible to error in RATS, PCNN, and SHERM, whereas U-Net performs similarly to the ground truth.

