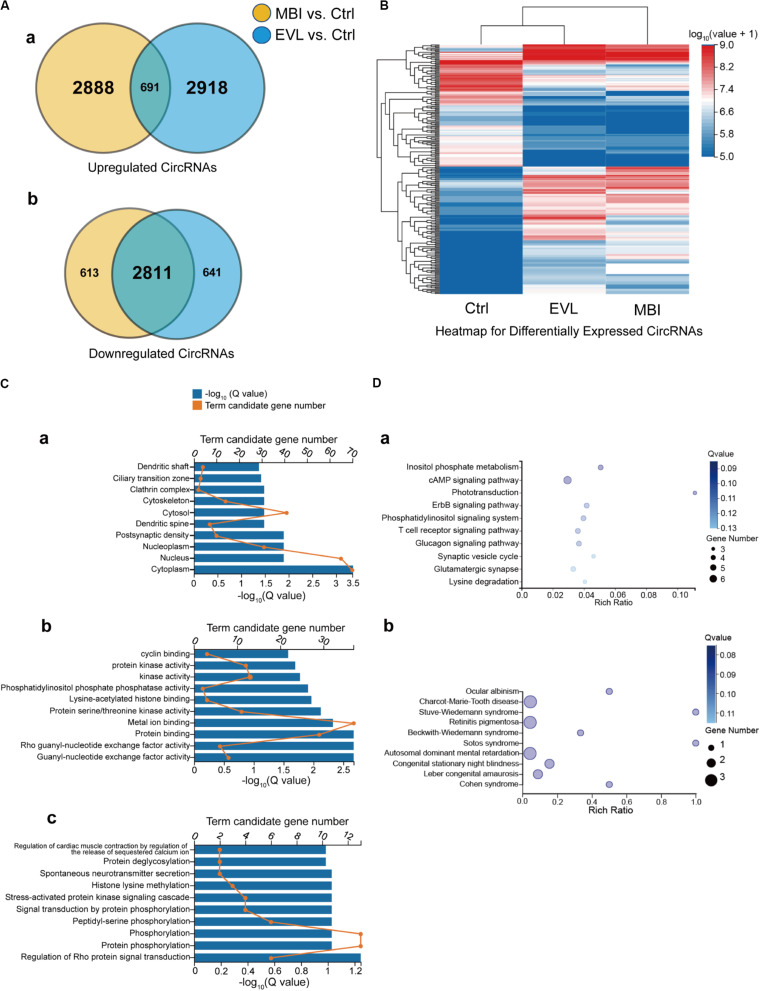
FIGURE 3.
Venn diagram, heatmap, GO and KEGG enrichment results of the differentially expressed circRNAs and their source genes. EVL, episcleral vein ligation; MBI, microbead injection; Ctrl, control; GO, gene ontology; KEGG, Kyoto Encyclopedia of Genes. (A) Differentially expressed circRNAs are shown in the two Venn diagrams: (a) upregulated circRNAs and (b) downregulated circRNAs. Yellow: differentially expressed circRNAs between the MBI and Ctrl groups. Blue: differentially expressed circRNAs between the EVL and Ctrl groups. Intersection: circRNAs differentially expressed with the same tendency in both comparisons (MBI vs. Ctrl, EVL vs. Ctrl). (B) Hierarchical clustering of the differentially expressed circRNAs (totality: 237) with expression values above zero were evolved in expression comparison. Expression levels above and below the median expression level are indicated with different colors in all groups. (C) 157 intragenic source genes of differentially expressed circRNAs for GO enrichment analysis in terms of cell component (a), molecular function (b) and biological process (c). (D) KEGG pathway analysis (a) and KEGG disease analysis (b) for the 157 intragenic source genes.

