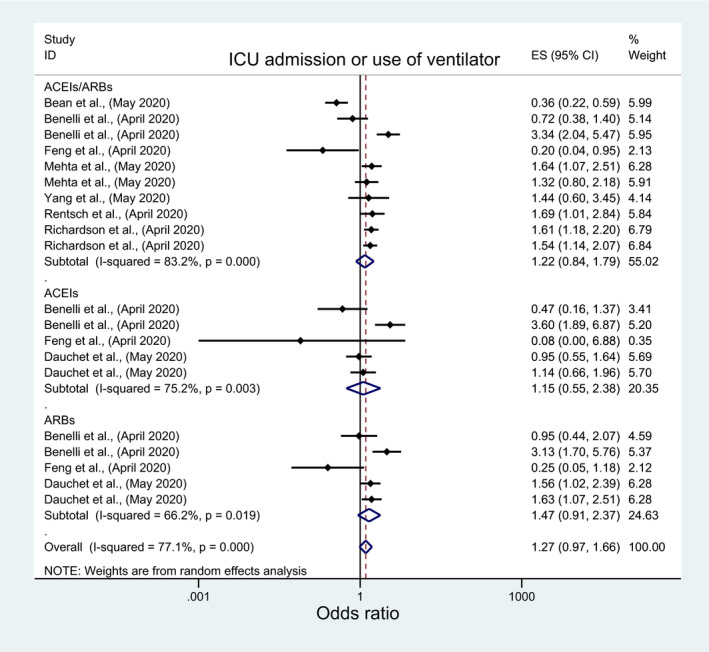
FIGURE 10.

Forest plot depicting pooled estimates for the association between use of ventilator/Intensive Care Unit admission and the three levels of renin‐angiotensin system drug exposure (ACEIs/ARBs, ACEIs, ARBs)

Forest plot depicting pooled estimates for the association between use of ventilator/Intensive Care Unit admission and the three levels of renin‐angiotensin system drug exposure (ACEIs/ARBs, ACEIs, ARBs)