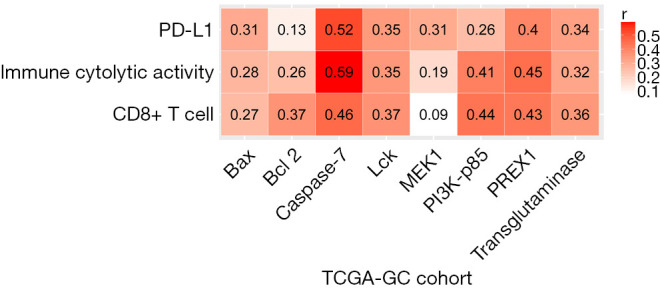
Figure 3.

Correlation of protein expression levels with CD8+ T cell enrichment levels, immune cytolytic activity, and PD-L1 expression levels in TCGA-GC cohort. The Pearson correlation coefficients are shown.

Correlation of protein expression levels with CD8+ T cell enrichment levels, immune cytolytic activity, and PD-L1 expression levels in TCGA-GC cohort. The Pearson correlation coefficients are shown.