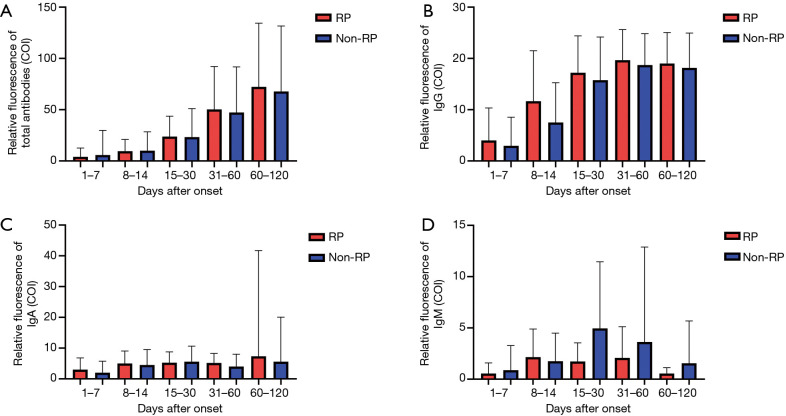
Figure 2.
Dynamics of SARS-CoV-2 specific antibodies. The levels of total Ab (A), IgG (B), IgA (C), and IgM (D) of different patients after illness onset. The relative antibody level was estimated using COI, expressed as the mean (denoted by columns) and SD (denoted by error bars). Red and blue columns represent RP and NRP Patients, respectively.

