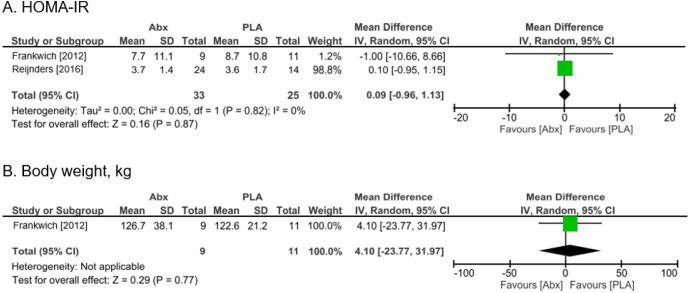
Figure 3.
The results of meta-analysis of primary outcomes. Forest plot showing odds ratio and 95% confidence interval for each study along with study weight. Abx, antibiotics; CI, confidence interval; FPG, fasting plasma glucose; GLP, glucagon-like peptide; HOMA-IR, homeostasis model assessment of insulin resistance; MD, mean difference; SD, standard deviation.

