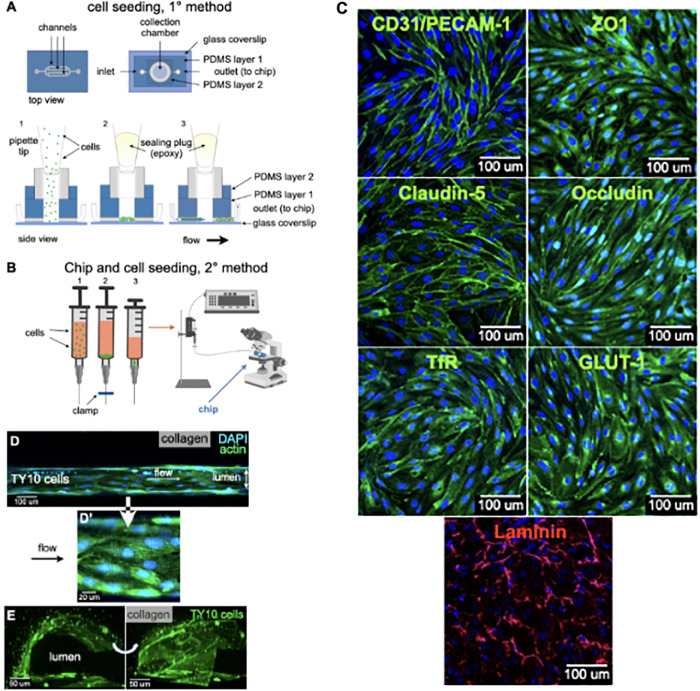
FIGURE 2.
Cell seeding procedures and formation of a human brainmicrovessel using TY10 cells. (A) Cell seeding, 1st method. Representation of the steps used to increase the cell concentration before injection into the chip. Cells are allowed to settle by gravity (left and central panels) in the cell seeder and then injected as a bolus into the hollow lumen. Prior to injection, the chamber is capped with a plugged pipette tip (central panel). (B) Cell seeding, 2nd method. Representation of the steps used to inject cells into the chip in a more controlled and uniform manner compared to the 1st method. Cells are allowed to settle at the bottom of a syringe, and are then delivered into the hollow lumen at constant flow controlled by a syringe pump. (C) Immunostaining of TY10 monolayers: endothelial cell marker PECAM-1/CD31, transporters Glut-1 and transferrin receptor (TfR), and tight junction proteins ZO-1, Occludin and Claudin-5. Staining for laminin provides evidence that TY10 cells deposit extracellular matrix while in culture. Scale bar, 100 μm. (D) Representative image of a chemically fixed sample of TY10 cells after they were grown in the brain microvessel-on-a-chip with medium flowing from left to right at 1 μl/min for 7 days. Volumetric image was obtained using a spinning disk confocal microscope. Maximum z-projection is shown for a sample stained with DAPI (nuclei, blue) and phalloidin (actin, green). Scale bar, 100 μm. (D’) Representative image of a chemically fixed sample of TY10 cells after they were grown in the microfluidic-on-a-chip with medium flowing from left to right at 1 μl/min for 7 days. Single plane image was obtained using a Zeiss 710 confocal microscope. The image highlights the linear organization of actin stress fibers along the axis of flow. Sample stained with DAPI (nuclei, blue) and phalloidin (actin, green). Scale bar, 20 μm. (E) Representative volumetric image of a live sample of TY10-eGFP cells expressing membrane bound eGFP obtained using spinning disk confocal microscopy. The image highlights the organization of the cells as a monolayer at the boundary between the lumen of the artificial microvessel and the collagen scaffold. The cells on the bottom illustrate cells growing between the glass slide and the lumen. Panels are rotated 90-degrees from each other. Scale bar, 50 μm. See associated Supplementary Movie 2.

