FIGURE 4.
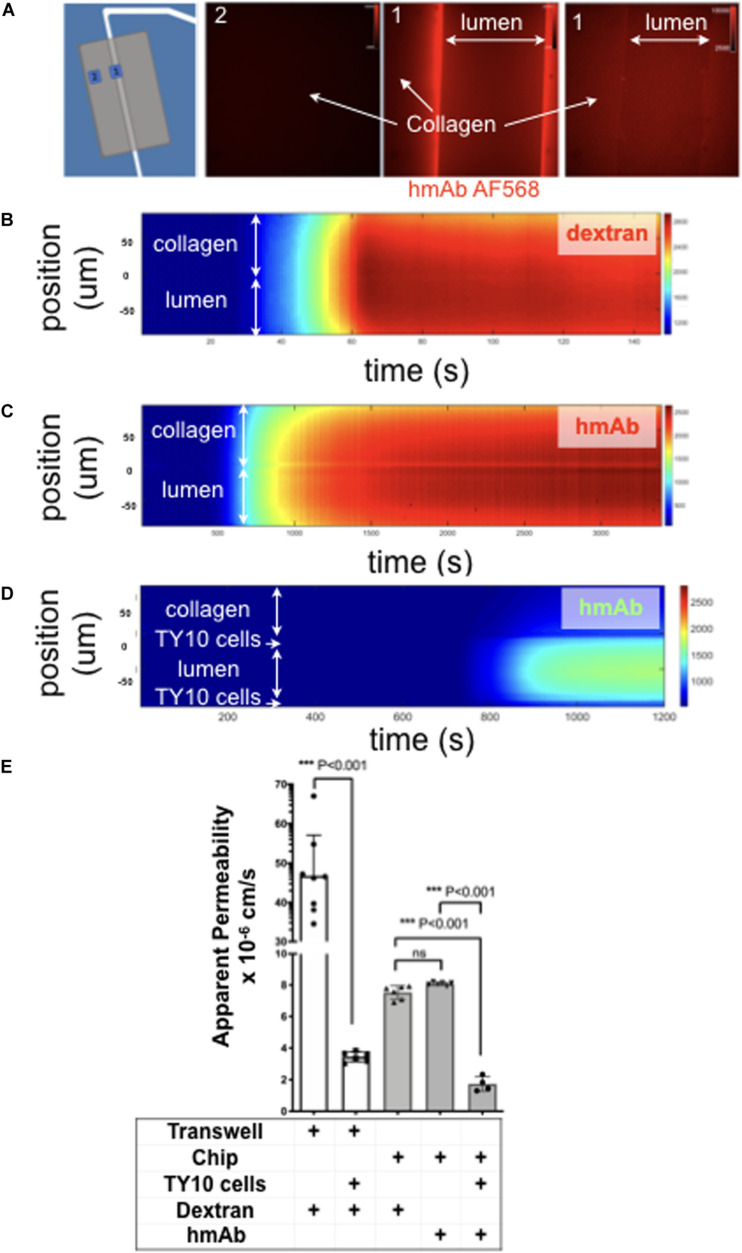
TY10 cells establish a functional barrier in the brain microvessel-on-a-chip. (A) The left panel is a schematic representation of the experimental setup used to determine the apparent permeability of fluorescent solutes diffusing between the lumen of the artificial microvessel and the collagen in the absence and presence of TY10 cells. The boxed numbered areas represent typical regions imaged using spinning disk confocal microscopy. The fluorescent images are of hmAb-AF568 (red) applied at constant flow (1 μl/min) for 20 min in the absence (left and central panels) and presence (right panel) of 1 mM TRIS in addition to Genipin (a chemical crosslinker) added to stabilize the collagen matrix (see Methods). Genipin followed by 1 mM TRIS treatment dramatically decreased the non-specific retention of the antibody by the collagen. (B–D) Heat map representation of the fluorescence intensity of 10 kDa FITC-Dextran (B) or antibody hmAb-AF568 (C) diffusing from the lumen through the collagen as a function of time obtained at a flow of 1 μl/min. The significant decrease in the amount of antibody that passes through the endothelial cell layer is highlighted in panel (D), demonstrating that TY10 cells form a functional barrier in the brain microvessel-on-a-chip. See associated Supplementary Movies 3–5. (E) Apparent permeability data for 10 kDa FITC-Dextran or hmAb-AF588 obtained from experiments carried with a traditional 2D transwell (n = 8 without TY10 cells and n = 6 with cells) and with the brain microvessel-on-a-chip (see B–D) without (n = 6) and with (n = 4) cells. The experiments compare the apparent permeability of the soluble molecules in the absence or presence of cells between the two compartments of the transwell, or between the boundary of the lumen and collagen in the brain microvessel-on-a-chip. One-way ANOVA and student’s t-test analyses with Bonferroni post-hoc correction was used to identify significant differences between samples. Error bars indicate SEM.; ***p ≤ 0.001, ns: non-significant.

