Figure 2.
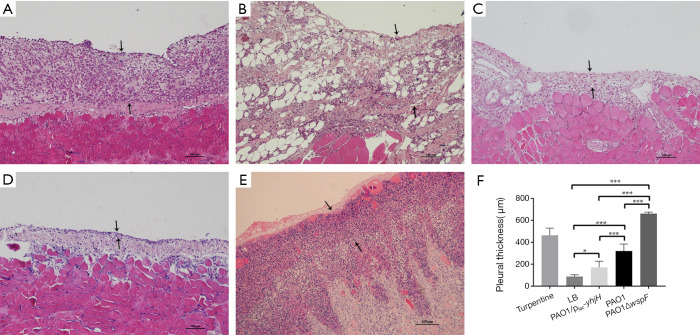
The morphological changes of the parietal pleura (HE staining, 10×). The area between the two black arrows is the pleura. (A) In the PAO1 infection group, there was thickening of parietal pleura, accompanied by many inflammatory cells infiltration. (B) In the PAO1ΔwspF infection group, the thickening of the parietal pleura was more significant than that in the PAO1 group, accompanied by a large number of inflammatory cell infiltration. (C) In the PAO1/plac-yhjH infection group, the parietal pleura was slightly thickened with only mild inflammation. (D) In the LB control group, few inflammatory cells infiltrated into the pleura. (E) In the turpentine control group, there was severe aseptic inflammation. (F) Pleural thickness. Results displaying the mean ± SD. An asterisk indicates significant difference, *, P<0.05; ***, P<0.001. The ANOVA tested. (300×300 DPI). LB, Luria-Bertani.

