Figure 4.

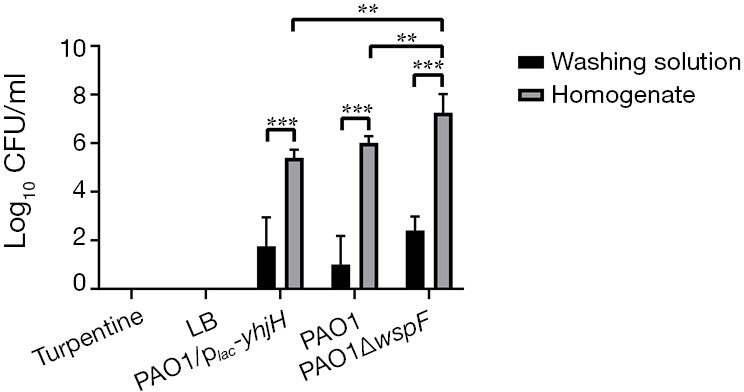
The colony counts of fibrinous deposition in the purulent exudate. Results displaying the mean ± SD. An asterisk indicates a significant difference, **, P<0.01; ***, P<0.001. (1,800 px minimum). LB, Luria-Bertani.

The colony counts of fibrinous deposition in the purulent exudate. Results displaying the mean ± SD. An asterisk indicates a significant difference, **, P<0.01; ***, P<0.001. (1,800 px minimum). LB, Luria-Bertani.