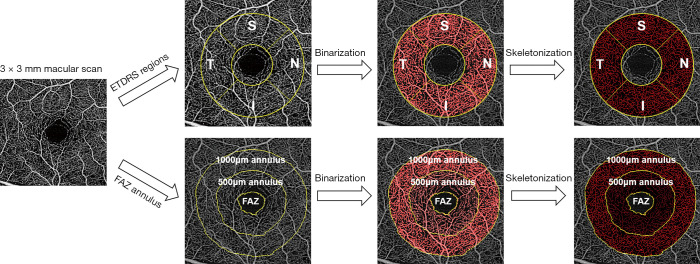
Figure 5.
Illustration of a possible analysis of a macular OCTA image. Quadrant analysis (superior, inferior, nasal, temporal) on an annulus is shown in the upper row and FAZ annulus analysis based on manual FAZ delineation is depicted in the lower row. OCTA, optical coherence tomography angiography; FAZ, fovea avascular zone.

