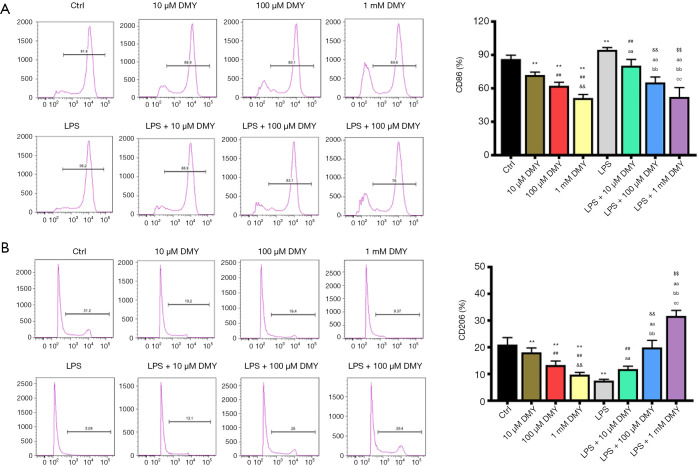
Figure 2.
The effects of DMY on the cell percentage of M1 and M2 polarization. The CD86 percentage (A) and CD206 percentage (B) in the study groups. **, P<0.01 vs. control group; ##, P<0.01 vs. LPS group; &&, P<0.01 vs. 100 µM DMY; $$, P<0.01 vs. LPS + 100 µM DMY; aa, LPS + 10 μM DMY vs. LPS; bb, LPS + 100 μM DMY vs. LPS + 10 μM DMY, and LPS; cc, LPS + 1 mM DMY vs. LPS + 100 μM DMY, LPS + 10 μM DMY, and LPS. DMY, dihydromyricetin; LPS, lipopolysaccharide.

