Figure 6.

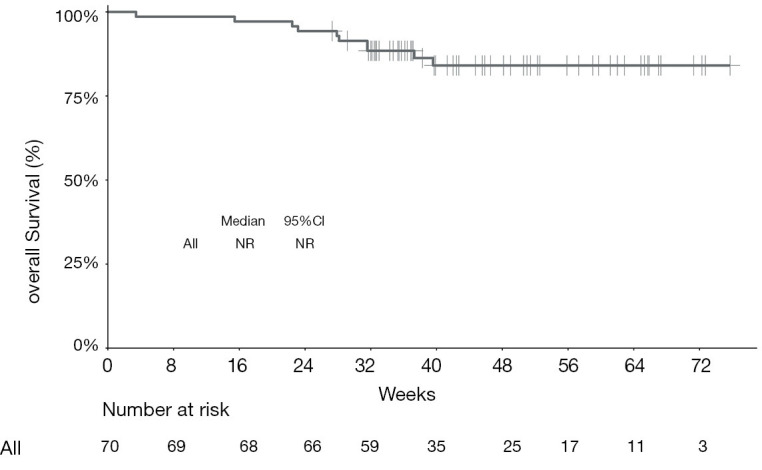
Kaplan-Meier curve showing overall survival for the entire cohort of patients treated with programmed cell death protein‐1 (PD‐1) ‐targeted immunotherapy. NR, not reached; CI, confidence interval.

Kaplan-Meier curve showing overall survival for the entire cohort of patients treated with programmed cell death protein‐1 (PD‐1) ‐targeted immunotherapy. NR, not reached; CI, confidence interval.