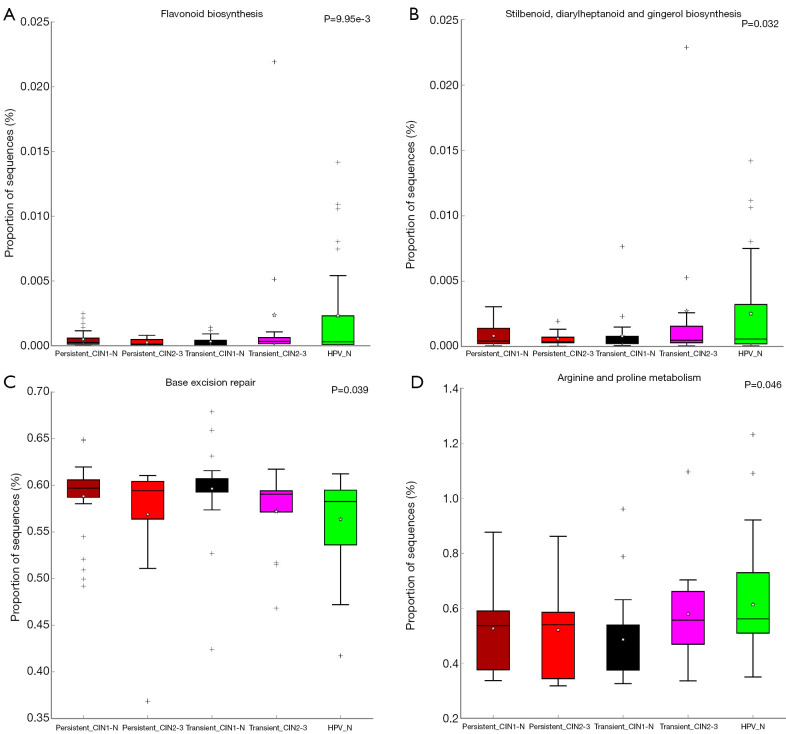
Figure 6.
Box plot analysis of the KEGG enriched pathways among the five groups of cervical scraping samples. Based on the gene function profiles predicted with the PICRUSt software, the relative expression of the KEGG pathways in the five groups were compared. (A) Comparison of flavonoid biosynthesis in the five groups. (B) Comparison of stilbenoid, diarylheptanoid, and gingerol biosynthesis in the five groups. (C) Comparison of base excision repair in the five groups. (D) Comparison of arginine and proline metabolism in the five groups. *, infinitesimal deviation; +, mild diverge.

