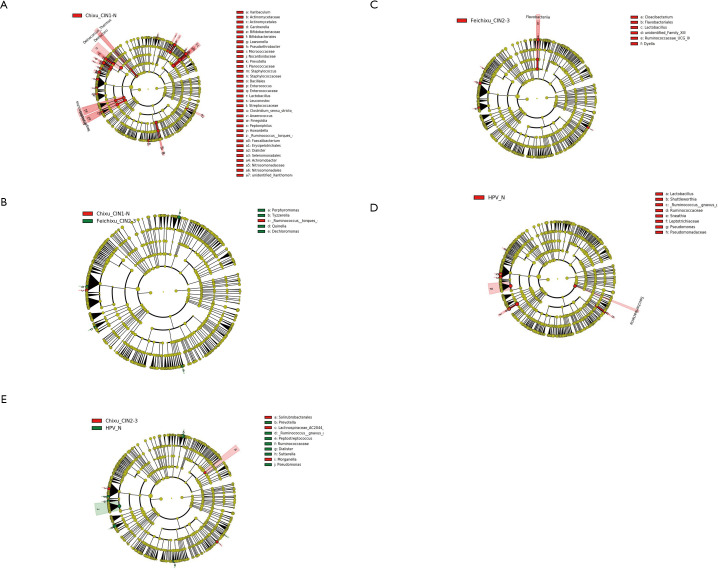
Figure S2.
Evolutionary branch diagram of differential florae with different abundance between groups. Circle radiating from the inside to the outside represents the classification level from the door to the genus (or species). Each small circle at a different classification level represents a classification at that level, and the diameter of the small circle is proportional to the relative abundance. (A) Evolutionary branch diagram of the microbiota with different abundance between high-risk human papillomavirus (HPV) persistent infection with higher-grade squamous intraepithelial lesion (HSIL) and the high-risk HPV persistent infection with lower-grade squamous intraepithelial lesion (LSIL) group. (B) Evolutionary branch diagram of the microbiota with different abundance between the high-risk HPV persistent infection with LSIL group and high-risk HPV transient infection with HSIL group. (C) Evolutionary branch diagram of the microbiota with different abundance between high-risk HPV transient infection with HSIL group and high-risk HPV transient infection with LSIL group. (D) Evolutionary branch diagram of the microbiota with different abundance between high-risk HPV transient infection with LSIL group and the non-infected HPV group. (E) Evolutionary branch diagram of the microbiota with different abundance between high-risk HPV persistent infection with HSIL and the non-infected HPV group.

