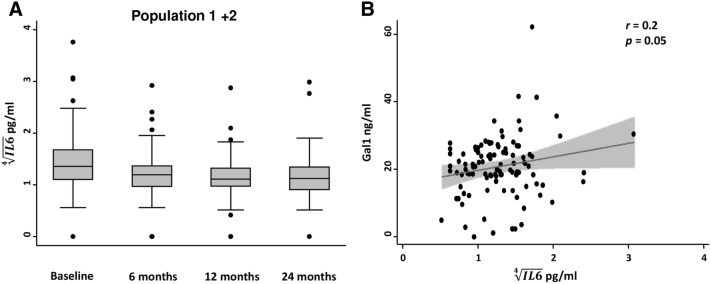
Figure 3.
Gal1 serum levels correlate with IL-6 serum levels in early arthritis. (A) Evolution along the follow-up of IL6 serum levels (Population 1 plus Population 2) in early arthritis patients. Data are shown as interquartile range (p75 upper edge, p25 lower edge, p50 midline), p95 (line above the box) and p5 (line below the box).Dots represent outliers. (B) Moderate correlation between Gal1 and IL6 serum levels (Population 1 plus Population 2) in early arthritis patients. Data are shown as dot-plots and their fitted linear prediction with 95% confidence interval (grey shadow) estimated using the twoway command of Stata with the lfitci option. Pearson correlation test was used to determine the level of significance.

