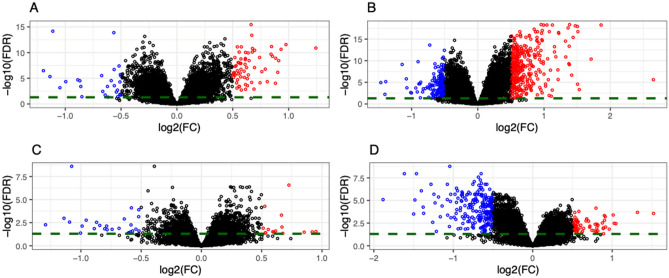
Figure 1.
Volcano plots of differentially expressed genes in pairwise comparisons across delivery modes. Differentially expressed genes (DEG) are selected based on FDR ≤ 0.05 and absolute value of log2(fold-change) ≥ 0.5; genes with ≥ twofold-change are labeled in each plot. (A) DEGs (N = 91) in vaginal delivery vs. CS (with or without labor). Genes are colored based on upregulation (red; N = 64) or downregulation (blue; N = 27) in CS (with or without labor). (B) DEGs (N = 506) in vaginal delivery vs. CS with labor. Genes are colored based on upregulation (red; N = 343) or downregulation (blue; N = 163) in CS. (C) DEGs (N = 41) in vaginal delivery vs. CS without labor. Genes are colored based on upregulation (red; N = 15) or downregulation (blue; N = 26) in CS. (D) DEGs (N = 263) in CS with labor vs. without labor. Genes are colored based on upregulation (red; N = 60) or downregulation (blue; N = 203) in CS without labor. VD N = 181, CS with labor N = 60, CS without labor N = 83. FDR false discovery rate, FC fold-change, CS cesarean section, VD vaginal delivery.

