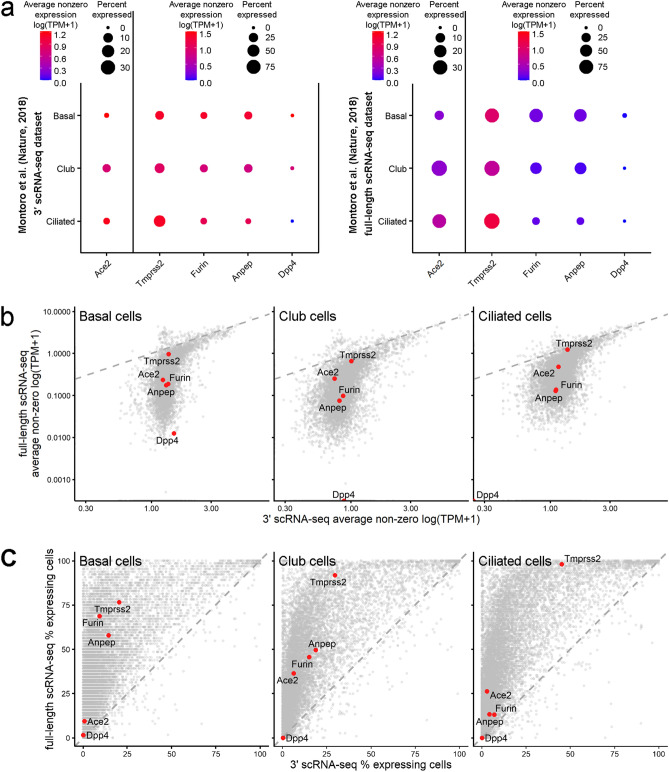
Figure 1.
The proportions of cells expressing SARS-CoV-2 entry factors are underestimated in standard scRNA-seq datasets. (a) Expression of the SARS-CoV-2 entry factors Ace2, Tmprss2, Furin, Anpep and Dpp4 in mouse trachea datasets from Montoro et al.10: 3′ scRNA-seq dataset (left panel) and full-length scRNA dataset (right panel). For the 3′ scRNA-seq dataset, unique molecular identifier (UMI) counts were normalized to account for differences in coverage, multiplied by a scaling factor of 10,000 to generate transcripts per kilobase million (TPM)-like values, and then log transformed. TPM values from the full-length scRNA dataset were rescaled to sum to 10,000 and were log transformed. Gene expression estimates were summarized in accordance with the cell type labels provided in the original paper. The dot size indicates the proportion of cells among the respective cell type population with greater-than-zero expression of the respective SARS-CoV-2 entry factor, while the dot color indicates the average nonzero expression value. (b) Correlation between gene expression in the 3′ scRNA-seq dataset and the full-length scRNA dataset for basal cells, club cells and ciliated cells. The Ace2, Tmprss2, Furin, Anpep and Dpp4 expression levels are represented by colored dots. (c) Full-length scRNA-seq detects a substantially higher number of cells with greater-than-zero expression of genes, including SARS-CoV-2 entry factors, among basal cells, club cells and ciliated cells. The percentages of cells expressing Ace2, Tmprss2, Furin, Anpep and Dpp4 are represented by the colored dots.

