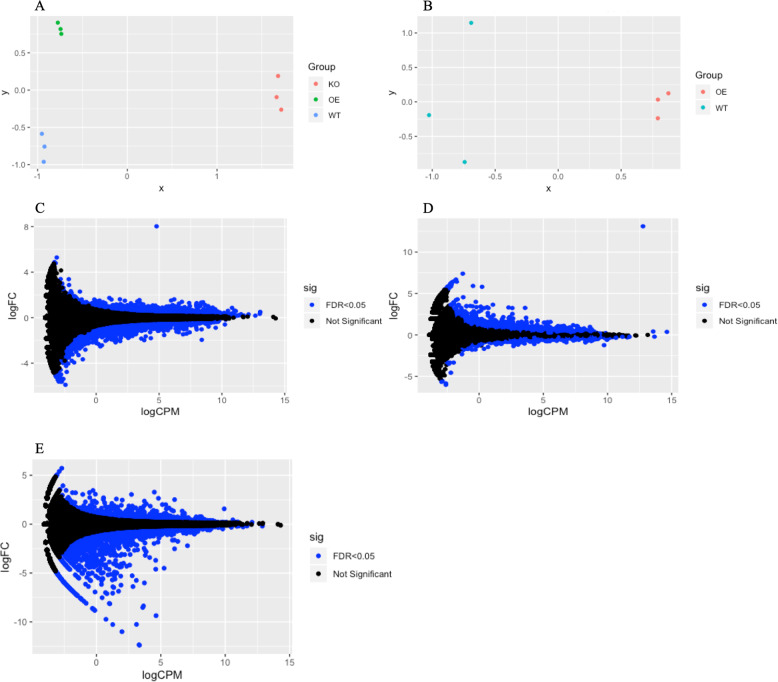
Fig. 2. RNA-Seq data analysis of human cell lines with SKOR1 gene overexpressed or silenced.
a MDS plot of the RNA-Seq data analyzed in HAP1 with clusters of HAP1 SKOR1-KO (in red), HAP1 SKOR1-OE (in green) and HAP1 parental WT cells (in blue). b MDS plot of the RNA-Seq data analyzed in HEK293 cells with clusters of HEK293 SKOR1-OE (in red) and HEK293 WT cells (in blue). c MD plot of the DEGs comparing HAP1 cells overexpressing SKOR1 with the parental wild-type cells; the single data point with a high LogFC indicates SKOR1. d MD plot of the DEGs comparing HEK293 cells overexpressing SKOR1 with the wild-type cells; the single data point with a high LogFC indicates SKOR1. e MD plot of the DEGs comparing HAP1 SKOR1-KO cells with their parental WT cells (blue data points in c, d, and e correspond to DEGs with FDR < 0.05).

