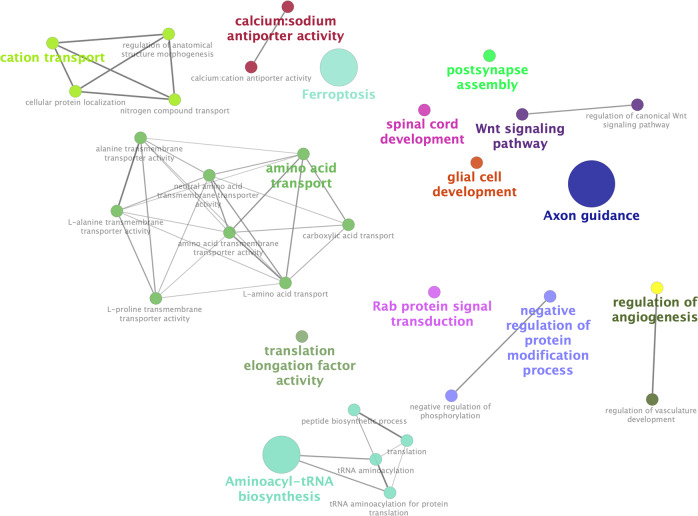
Fig. 4. Interactions between the pathways significantly enriched in the DEGs possibly repressed or activated by SKOR1.
The interactions are visualized by ClueGO and CluePedia (Cytoscape software plug-in). The size of the circles corresponds to their p value. The pathways are colored based on the groups.

