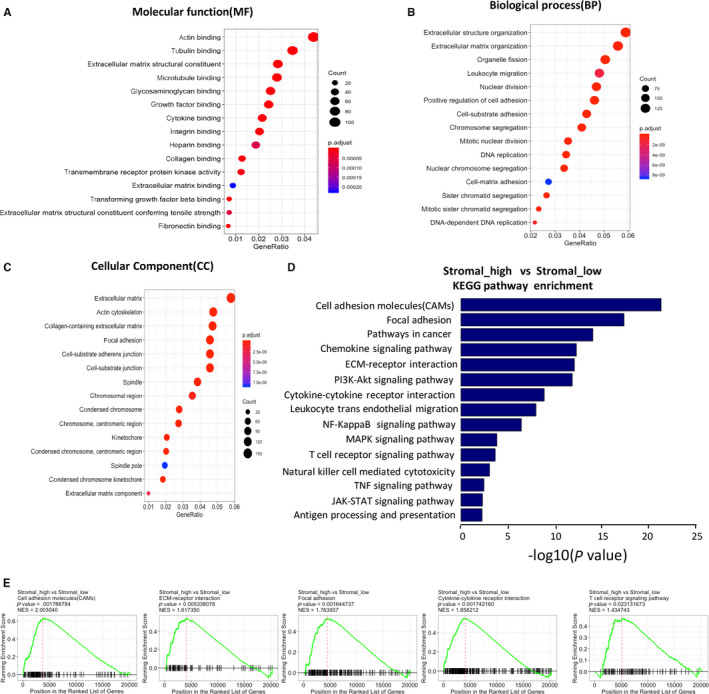
FIGURE 3.

Comparison of gene expression profile with stromal scores in GC. A‐C, GO analysis to explore the 3000 most different genes participate in molecular function (MF) (A), biological process (BP) (B) and cellular component (CC) (C). D, To explore the 3000 most different genes involved in signalling according to the Kyoto Encyclopedia of Genes and Genomes (KEGG) data sets. E, GSEA of the data of RNA‐sequencing, which show these KEGG signalling pathways are up‐regulated in the ‘stromal_high’ group
