
FIGURE 3.
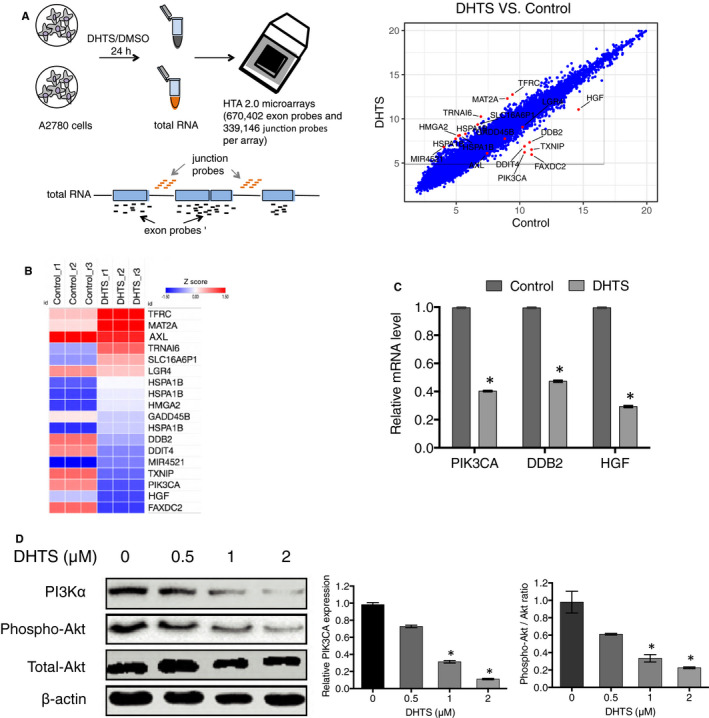
Critical role of PI3K/AKT signalling pathway in DHTS induced A2780 ovarian cancer cell death. A, Scatter plot comparing global gene expression profiles in DHTS‐treated and DMSO‐treated A2780 ovarian cancer cells. Each dot presented on the graph corresponds to one transcript. A2780 cells were treated with DHTS (2 μM) or DMSO (Control) for 24 h, followed by total RNA isolation and Affymetrix HTA 2.0 array. B, Heat map of differentially expressed genes found in DHTS‐treated vs. DMSO‐treated A2780 cells. C, mRNA expression levels of PIK3CA, DDB2 and HGF detected by real‐time PCR. A2780 cells were treated with DHTS (2 μM) or DMSO for 24 h, followed by mRNA isolation and real‐time PCR. D, Regulation of PI3K/AKT signalling pathway in A2780 ovarian cancer cells treated with DHTS. Western blotting was performed to determine the expression or phosphorylation of PI3Kα, p‐AKT and AKT in A2780 cells treated with DHTS (0, 0.5, 1 and 2 μM) for 48 h. *P < .05 vs. untreated control