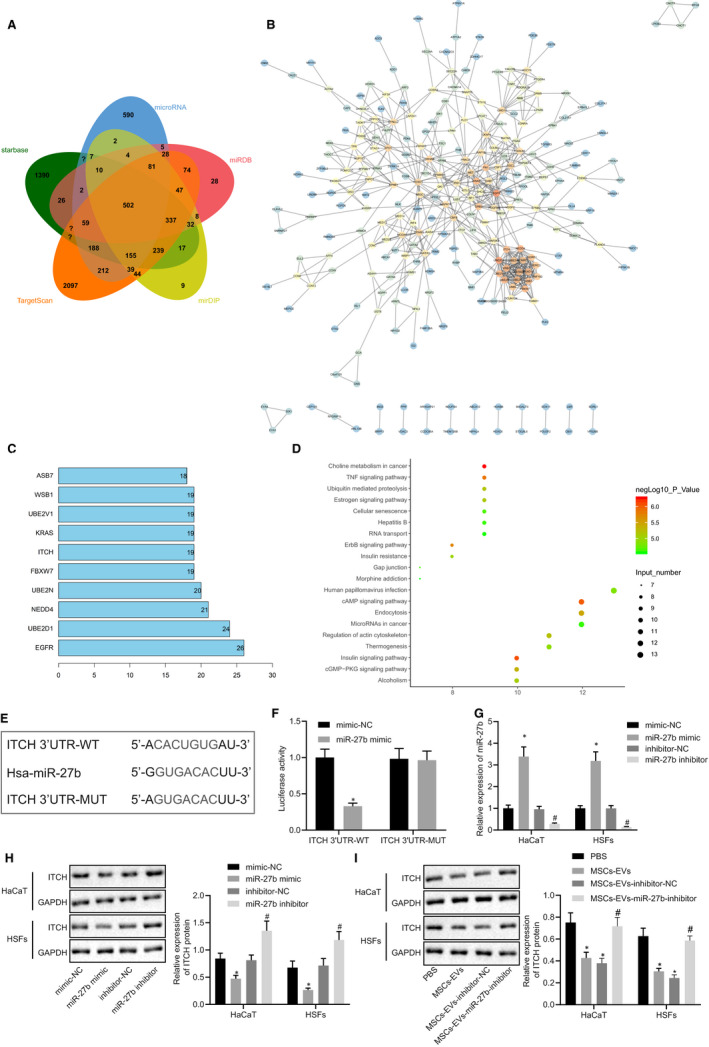
FIGURE 4.

ITCH is directly targeted by miR‐27b in HaCaT cells and HSFs. (A) Predicted downstream target genes of miR‐27b by the starBase, microRNA.org, miRDB, mirDIP and TargetScan databases. The five ellipses in the figure represent the predicted results from the five databases, respectively, and the middle part represents the intersection. (B) Candidate target gene interaction analysis. Each circle in the figure represents a gene, and the line between circles represents the interaction between genes. The more interacted genes of a gene reflected higher core degree, and darker colour. (C) The top 10 genes with the largest core degree value. The abscissa represents the degree value, and the ordinate represents the gene name. (D) KEGG pathway enrichment analysis of candidate target genes. The abscissa represents the gene data in the items, and the ordinate represents the KEGG items. The right histogram represents colour scale. (E) Putative miR‐27b binding sites in the 3’UTR of ITCH mRNA in the starBase database. (F) miR‐27b binding to ITCH was confirmed by dual‐luciferase reporter gene assay in cells; *P < .05 compared with the transfection with mimic‐NC. (G) Expression of miR‐27b was examined by RT‐qPCR in HaCaT cells and HSFs transfected with miR‐27b mimic or inhibitor, normalized to U6; *P < .05 compared with mimic‐NC transfection; #P < .05 compared with inhibitor‐NC transfection. (H) Representative Western blots of ITCH protein and its quantitation in HaCaT cells and HSFs transfected with miR‐27b mimic or miR‐27b, normalized to GAPDH. I, Representative Western blots of ITCH protein and its quantitation in HaCaT cells and HSFs treated with PBS and MSC‐derived EVs, normalized to GAPDH; *P < .05 compared with PBS treatment; #P < .05 compared with treatment of EVs derived from MSCs transfected with inhibitor‐NC. Data between the two groups were compared by unpaired t test. Data are shown as mean ± standard deviation of three technical replicates
