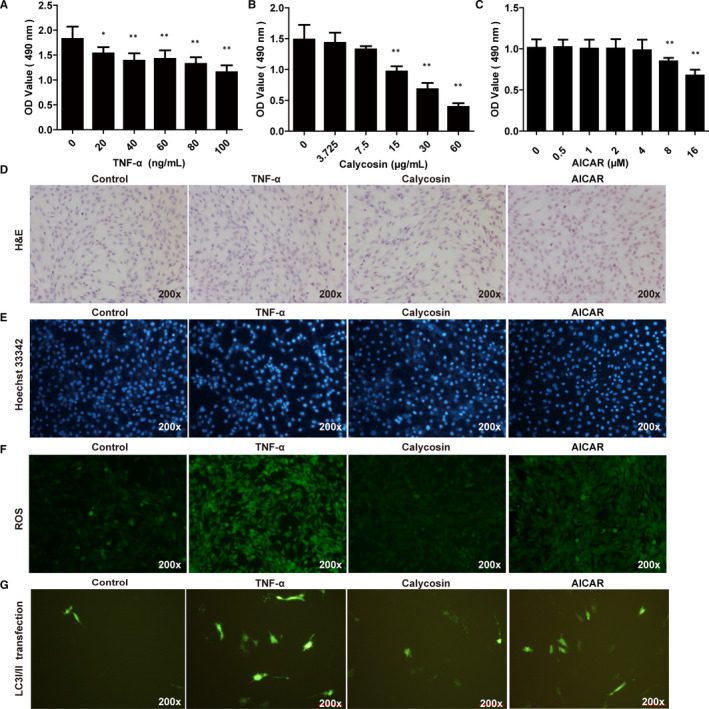
FIGURE 7.

Effect of calycosin on myotube atrophy in TNF‐α induced C2C12 cells in vitro. A‐C, Cytotoxicity of TNF‐α, calycosin and AICAR in C2C12 cells. *P < 0.05 compared to control cells. D, Representative images of H&E staining of C2C12 cells treated with TNF‐α or calycosin (×200). *P < 0.05 compared to control cells. ## P < 0.01 compared to TNF‐α induced cells. E, Representative images of cell apoptosis in C2C12 cells treated with TNF‐α or calycosin using Hoechst 33342 staining. *P < 0.05 compared to control cells. ## P < 0.01 compared to TNF‐α‐induced cells. F, Representative images of ROS production in C2C12 cells treated with TNF‐α or calycosin. G, Representative images of LC3A/B plasmid transfection in C2C12 cells treated with TNF‐α or calycosin
