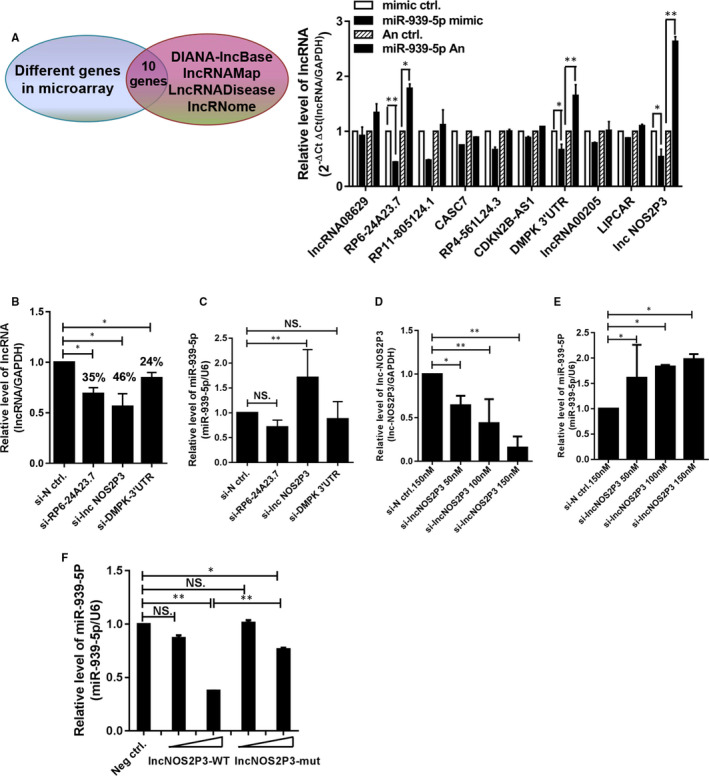
Figure 5.

Selection of candidate lncRNAs interacted with miR‐939‐5p. A, 10 potential candidate lncRNAs from lncRNA‐databases filtration of differentially expressed genes in lncRNA microarray. 100 nM miR‐939‐5p mimic or antagomir and their controls were transfected into HUVECs. RNA was isolated and assayed by RT‐qPCR, results are presented relative to GAPDH (2‐ΔΔCt). B and C, 100 nM smart silencers of 3 lncRNAs (si‐lnc) were transfected into HUVECs. B, The interference effects were quantified by qRT‐PCR using lncRNAs specific primers from Ribobio, Guangzhou. C, MiR‐939‐5p was measured by qRT‐PCR, U6 as internal control. D and E, 50, 100, 150 nM smart silencers of lnc‐NO2P3 (si‐lnc‐NOS2P3) were transfected into HUVECs. D, The level of lnc‐NOS2P3 was determined. E, Relevant miR‐939‐5p levels were detected versus U6. F, 400 and 800 ng lnc‐NO2P3‐WT or lnc‐NO2P3‐mut and negative control were separately transfected into HUVECs, miR‐939‐5p levels were determined versus to U6. Data are mean ± SEM. *P < 0.05 and **P < 0.01
