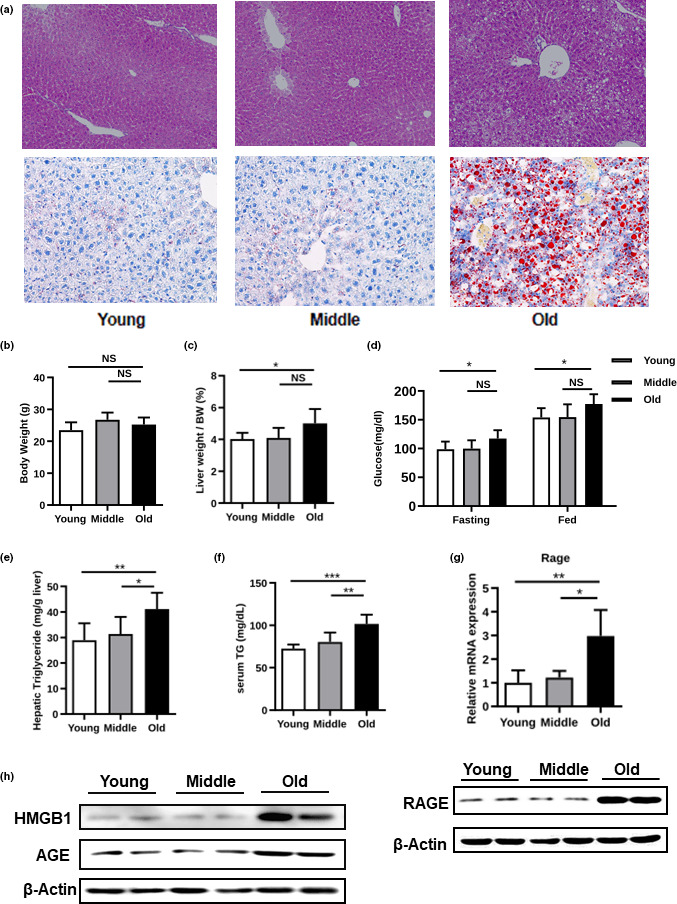
FIGURE 1.

NAFLD‐associated phenotypes in young, middle‐aged, and old C57BL/6 mice. (a) H&E‐ and oil red O (ORO)‐stained liver sections, (b) body weight, (c) liver‐to‐body weight ratio, (d) blood glucose, (e) hepatic triglycerides (TGs), (f) serum TG level, (g) real‐time PCR analysis of gene expression of RAGE, and (h) expression levels of HMGB1, AGE, and RAGE, as determined by Western blotting analysis
