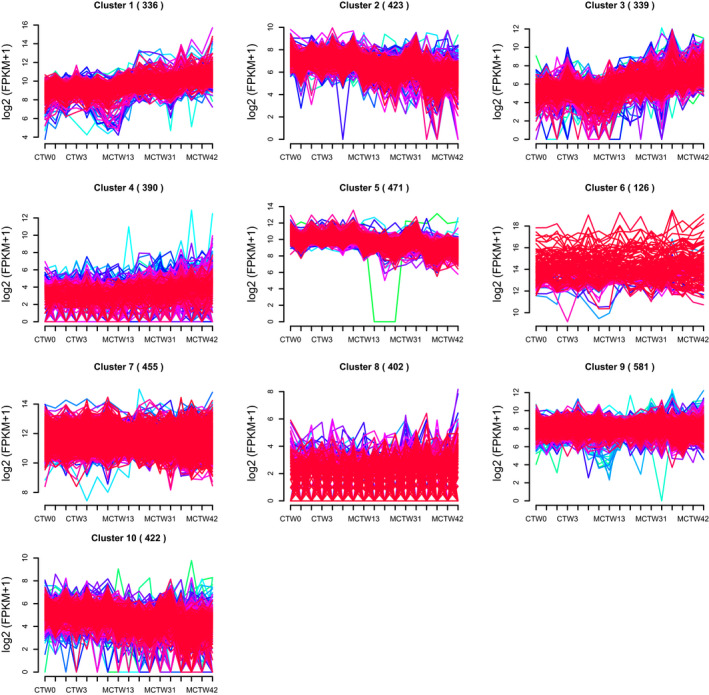
FIGURE 1.

Clustering analysis of differentially expressed genes (DEGs). A total of 23 200 transcripts and 280, 1342, 908 and 3155 DEGs were identified at the end of weeks 1, 2, 3 and 4 after monocrotaline treatment. Hierarchical clustering of these DEGs generated 10 clusters of expression pattern (distance metric, Pearson correlation; linkage rule, average linkage)
