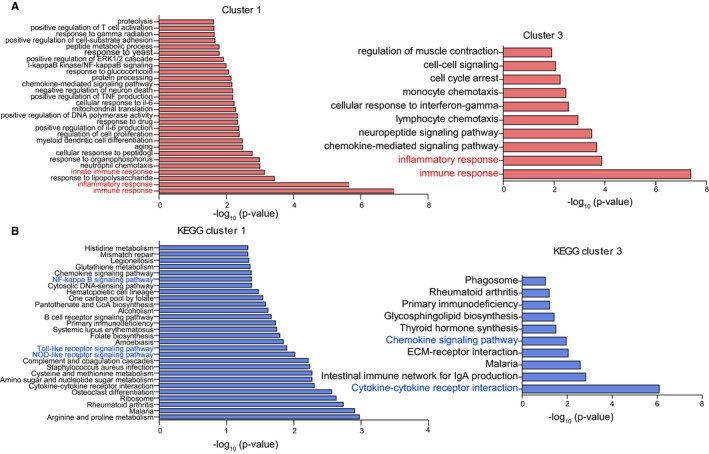
FIGURE 2.

Functional enrichment of differentially expressed genes (DEGs) in response to monocrotaline treatment. A, Gene Ontology (biological process) analysis of the DEGs identified in cluster 1 and cluster 3, biological process terms with only P‐value of <.02 and <.01 were showed in cluster 1 and cluster 3, respectively; B, KEGG pathway analysis of the DEGs identified in cluster 1 and cluster 3. KEGG pathway terms with the P of <.05 were showed in cluster 1 and cluster 3
