FIGURE 3.

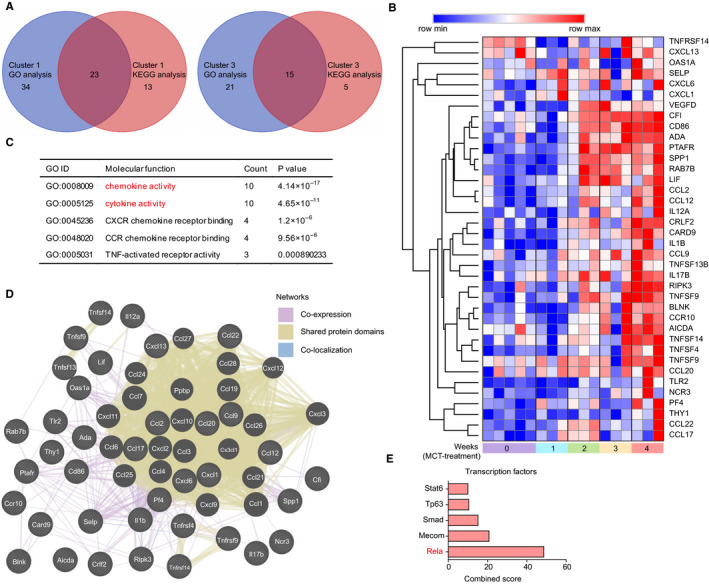
Inflammatory and immune profiling in monocrotaline‐induced pulmonary arterial hypertension. A, Venn diagram showing differentially expressed genes (DEGs) that were overlapped in Gene Ontology (GO) and KEGG enrichment analysis, the overlapped genes was determined by using Venny 2.1 software (https://bioinfogp.cnb.csic.es/tools/venny/). B, Hierarchical clustering of the overlapped DEGs by using Morpheus software (https://software.broadinstitute.org/morpheus/). C, Summary table for overrepresented GO molecular function terms in the overlapped DEGs. D, The network among the overlapped DEGs. E, The enrichment of highly represented transcription factors in overlapped DEGs by using ChEA 2016 database in Enrichr. The significantly enrichment terms were determined by combined score, and the top 5 transcription factors were showed
