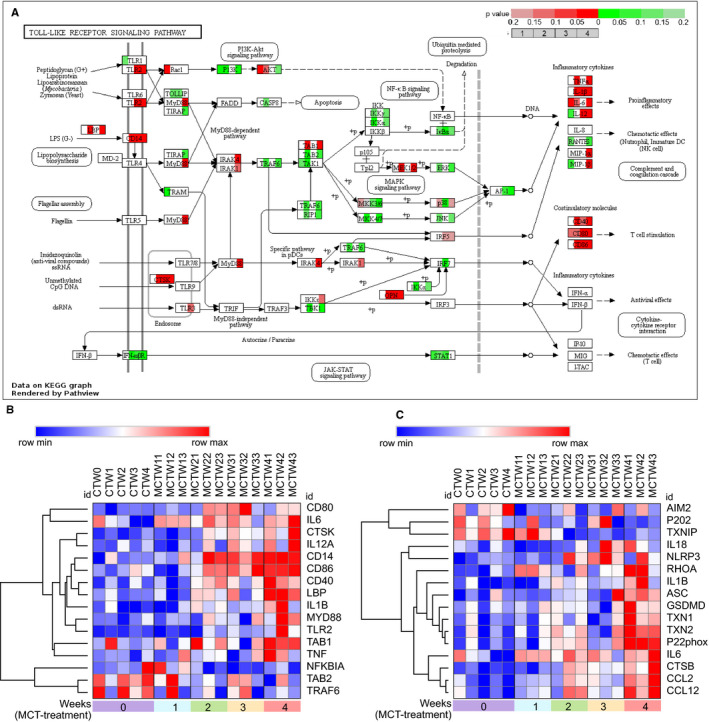
FIGURE 4.

The change of Toll‐like receptor (TLR) and Nod‐like receptor (NLR) pathways in response to monocrotaline (MCT) treatment. A, The integration and visualization of gene expression change in TLR pathways using modified Pathview. Each coloured box represents the comparison of MCT treatment 1 wk with control, MCT treatment 2 wk with control, MCT treatment 3 wk with control and MCT treatment 4 wk with control. Colour represents P‐value for each comparison of MCT treatments with control by using Morpheus software (unpaired t test); genes with relatively increased and reduced expression were shown in red and green, respectively, while white represents P ≥ .2 or not detected. B, C, Heatmap showing differentially expressed genes annotated in TLR and NLR pathways of KEGG database, rows in the heatmap represent gene expression levels, and columns represent each sample
