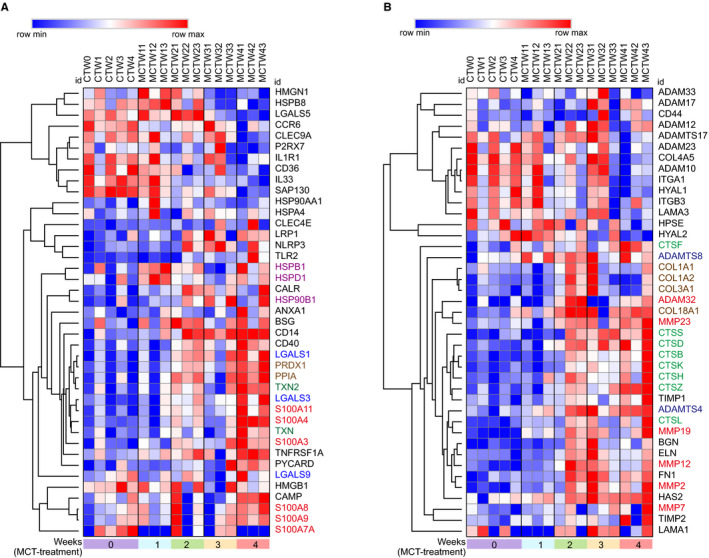
FIGURE 5.

The expression change of damage‐associated molecular patterns (DAMPs) in response to monocrotaline (MCT) treatment. A, Heatmap of differentially expressed intracellular DAMPs induced by MCT. B, Heatmap of differentially expressed extracellular DAMPs and their proteolytic enzymes induced by MCT. CTW, control; MCTW1, MCT treatment for 1 wk; MCTW2, MCT treatment for 2 wk; MCTW3, MCT treatment for 3 wk and MCTW4, MCT treatment for 4 wk
