
FIGURE 3.
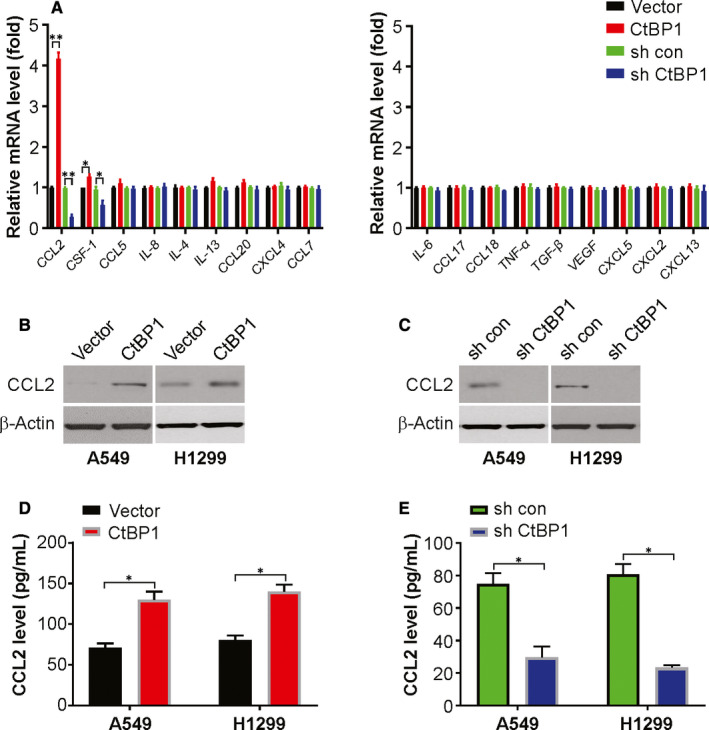
CtBP1 promotes CCL2 induction. (A) Relative mRNA level of indicated cytokines in CtBP1 overexpression or knockdown A549 cells was analysed by real‐time PCR. (B) Protein level of CCL2 in CtBP1 overexpression cells was analysed by Western blotting. (C) Protein level of CCL2 in CtBP1 knockdown cells was analysed by Western blotting. (D) Protein level of CCL2 in CtBP1 overexpression cells was analysed by ELISA. (E) Protein level of CCL2 in CtBP1 knockdown cells was analysed by ELISA. Data are derived from three independent experiments and presented as mean ± SD. *P < 0.05, **P < 0.01