
FIGURE 6.
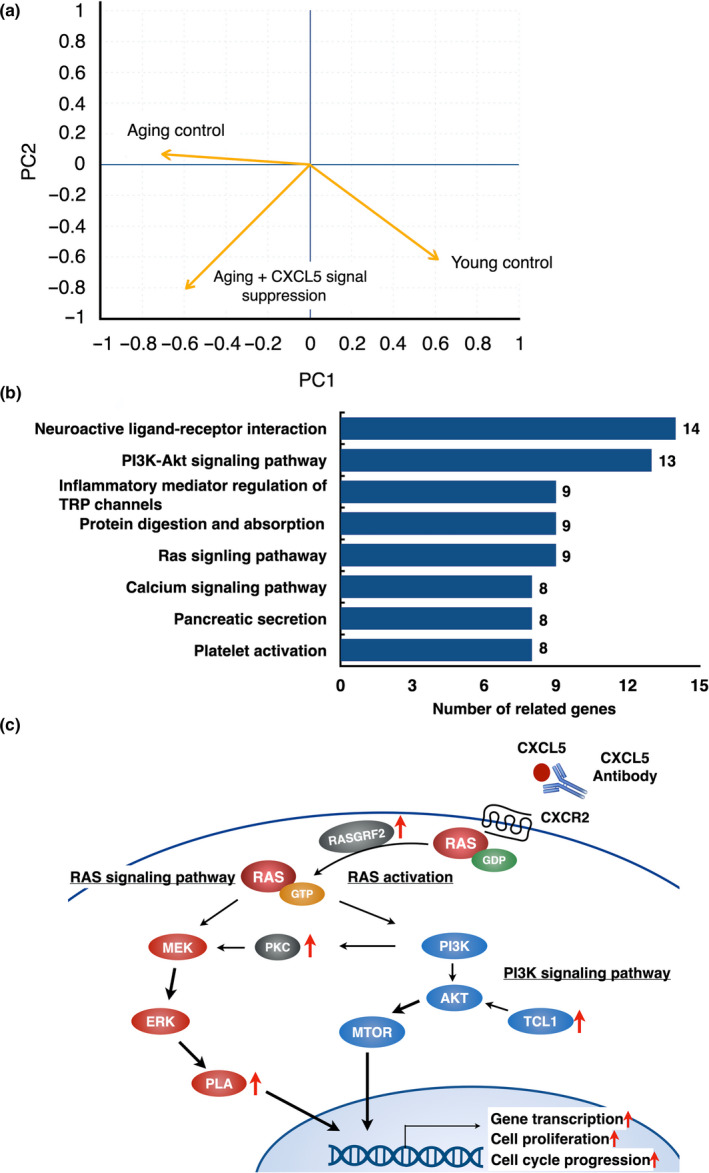
Analysis of differentially expressed genes between aging mouse blastocysts with and without CXCL5 signaling suppression. (a) Similarity of gene expression pattern of embryos between young and aging mouse blastocysts with or without CXCL5 signaling suppression. Using blastocysts samples, principal component (PC) analysis using data of microarray analysis was performed. (b) KEGG (Kyoto Encyclopedia of Genes and Genomes) pathway analysis on differentially expressed genes in aging embryos with or without CXCL5 signal suppression using data of microarray analysis. The graph showed the enriched pathways. Numbers listed on left of each column indicate the number of related genes. (c) Schematic diagram of enriched signaling pathway following suppression of CXCL5 signaling. PI3 K‐AKT and RAS signaling pathway were affected by CXCL5 signaling suppression. The genes located besides the red arrows are enriched and significantly up‐regulated in CXCL5‐suppressed aging blastocysts