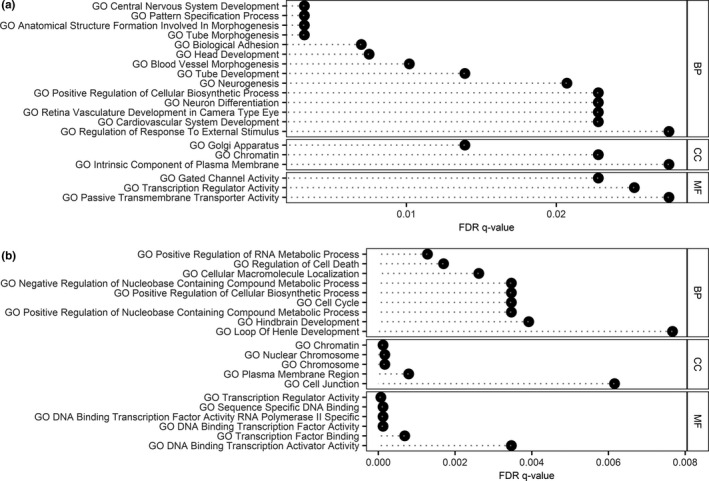
FIGURE 2.

Biological impact of identified hyper‐ (a) and hypomethylated (b) DMRs. Overlap of the DMR‐associated gene list with gene ontology (GO) data sets is shown along with the false discovery rate (FDR) q‐value. The 20 pathways with lowest FDR in the GO domains biological process (BP), cellular component (CC) and molecular function (MF) are displayed
